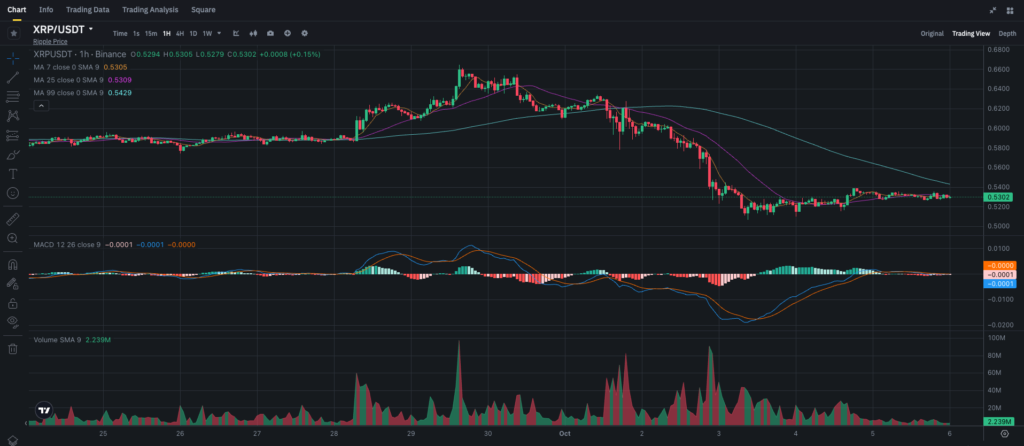
XRP has recently been under the microscope of many traders, especially after the cryptocurrency experienced a drop from the $0.65 level down to $0.53 over the past week. Ripple’s price has since stabilized, trading in a narrow range around $0.53, but the question remains: Is this consolidation a precursor to a breakout, or will XRP continue to languish in its current state?
Let’s break down XRP’s current technical picture and explore potential trading strategies for both short-term and long-term holders.
Overview of XRP’s Recent Price Action
Currently, XRP is trading at $0.5302, a far cry from its highs earlier this year, but still showing signs of life. The most notable aspect of the current price action is the period of consolidation it has entered, which has kept XRP within a tight range for the past several days.
There are no major events or announcements related to Ripple that could account for the sharp moves seen earlier, so much of the price action is driven by overall market sentiment, especially within the altcoin sector. The key question for traders now is whether XRP can reclaim the $0.55 zone and move higher or if another leg down is in store.
Technical Analysis of XRP
Moving Averages
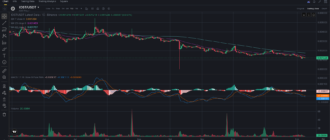
The 1-hour chart shows that XRP is struggling to break above the short-term moving averages. The 7-period SMA is at $0.5305, essentially sitting at the current price, which is a sign that the market is indecisive in the short term. The 25-period SMA at $0.5309 is providing immediate resistance, while the 99-period SMA sits higher at $0.5429, forming a significant longer-term resistance level.
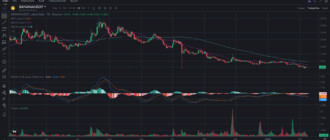
On the 4-hour chart, the 7-period SMA is aligned at $0.53, marking the current zone of consolidation, while the 25-period SMA stands at $0.53. These averages suggest that XRP is in a neutral phase, struggling to break higher, but also not crashing further.
MACD Indicator
The MACD (Moving Average Convergence Divergence) on both the 1-hour and 4-hour charts is relatively flat, indicating a lack of momentum in either direction. On the 1-hour chart, the MACD is hovering just above -0.0001, signaling that bearish momentum is slowing down, but no clear bullish signals are emerging.
The 4-hour chart MACD is more telling, as the indicator shows a neutral outlook, oscillating near zero. The MACD line is slightly above the signal line, indicating the possibility of a bullish crossover, but it’s too early to call a breakout just yet.
Volume Analysis
Volume has been declining steadily, which is another sign of consolidation. On the 1-hour chart, we can see the Volume SMA at 2.239M, with no significant spikes. The last major volume surge occurred on October 2, and since then, volume has been relatively flat.
Without a meaningful uptick in volume, it is hard to see XRP making a substantial move in either direction. Traders should watch for a surge in volume as a precursor to a potential breakout, especially as the price approaches key support and resistance levels.
Key Levels to Watch
Support Levels
- $0.52 – Immediate support, which has been tested several times in the past few days. A break below this level could trigger a sharper decline toward the next support level.
- $0.50 – Psychological and technical support, which would likely attract buyers if XRP were to dip that low.
Resistance Levels
- $0.54 – Immediate resistance, coinciding with the 99-period SMA on the 1-hour chart. A break above this level could set the stage for a move back toward the $0.55 zone.
- $0.55 – A key resistance level, which could signal the start of a new bullish trend if broken with strong volume.
Short-Term and Long-Term Outlook
Bullish Scenario
For XRP to regain its bullish momentum, it needs to break above the $0.54 resistance level, ideally with an increase in volume. If this level is broken, the next target would be $0.55, a significant resistance point that could pave the way for a larger rally.
Given the current lack of momentum, traders should watch for a potential bullish MACD crossover on the 4-hour chart. If accompanied by increased volume, this could be the signal to go long, with targets set around $0.55 and $0.58.
Bearish Scenario
On the flip side, if XRP fails to hold the $0.52 support level, it could quickly drop to $0.50 or lower. This could open up short-selling opportunities for traders who believe that XRP will continue its recent bearish trend.
In the bearish scenario, look for a breakdown in volume along with a bearish MACD crossover, which could signal further downside pressure. If $0.50 fails to hold, the next support would be in the $0.48 region.
Consolidation Scenario
It’s also entirely possible that XRP will continue to consolidate in the $0.52-$0.54 range for the coming days. This would present an opportunity for scalpers and day traders to capitalize on the short-term price fluctuations, entering and exiting positions within this range.
However, this strategy requires quick execution and tight stop losses, as any sudden breakout in either direction could lead to significant price swings.
Recommendations for Traders and Investors
For Short-Term Traders
- Bullish Entry: Enter a long position if XRP breaks above $0.54 with strong volume, targeting $0.55 or higher, and place a stop-loss just below $0.52.
- Bearish Entry: If the price breaks below $0.52, consider entering a short position with a target of $0.50, placing a stop-loss at $0.54.
For Long-Term Investors
For those looking to accumulate XRP over the long term, the $0.50 level could be an attractive entry point. Given the current lack of momentum, however, long-term investors may want to wait for a clear signal of recovery before committing to larger positions.
If the fundamentals of Ripple remain strong and you believe in the long-term value of the project, this consolidation phase could provide an opportunity to buy in at a relatively low price before the next bull run.
Conclusion
XRP is at a critical juncture, trading in a narrow range between $0.52 and $0.54. Whether it breaks higher or lower remains to be seen, but traders and investors alike should keep a close eye on key support and resistance levels, as well as the MACD and volume indicators for potential signals.
For short-term traders, there are opportunities on both the bullish and bearish sides, depending on how the price action unfolds. Long-term investors may want to wait for clearer signs of recovery or a dip toward $0.50 to accumulate at lower prices.
Stay updated on XRP and other cryptos by subscribing to my blog on Binance Square here for real-time analysis and insights!

