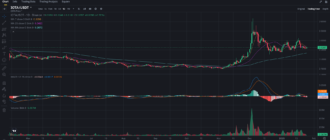
Wifiswap (WIF) has been showing some strong movements lately, rising from the lows of early October and regaining momentum. Traders are now wondering if this price action is the start of a new rally or simply a short-lived bounce before another pullback. With WIF currently trading around $2.33, it’s sitting at a pivotal point. Let’s dive into the chart analysis and explore what the indicators are signaling about WIF’s next move.
Short-Term Analysis: 1-hour Chart Breakdown
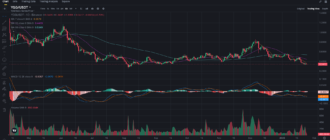
Looking at the 1-hour chart, WIF has seen a steady rise since bouncing from its recent low of $2.05 in early October. The token is now trading around $2.33, close to testing the resistance at $2.34. The 7-period Simple Moving Average (SMA) at $2.32 is providing short-term support, keeping WIF above key levels, while the 25-period SMA at $2.23 offers additional support below.
Meanwhile, the 99-SMA at $2.26 serves as a key dynamic support level for the token, marking the line between potential continued upward momentum and a pullback to previous lows. WIF has managed to stay above this critical level, which bodes well for the short-term outlook.

The MACD (Moving Average Convergence Divergence) on the 1-hour chart is showing a potential bullish signal, with the MACD line slightly above the signal line and the histogram printing green bars. However, the momentum is still relatively weak, so traders should watch for volume spikes to confirm whether this move will turn into a solid breakout or fade back into consolidation.
One important thing to note is that volume on the 1-hour chart remains subdued. While the price is creeping higher, the lack of significant volume could make WIF vulnerable to sharp reversals if buying pressure doesn’t increase.
Medium-Term Outlook: 4-hour Chart Analysis
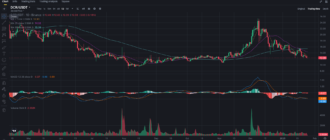
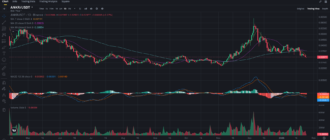
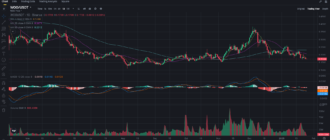
Shifting to the 4-hour chart, WIF presents a more optimistic picture. After bottoming around $2.05, the token has staged a solid recovery, and the current price is sitting just below the $2.34 resistance level. The 7-SMA at $2.22 and the 25-SMA at $2.26 are providing strong support, while the 99-SMA at $2.07 acts as long-term support, significantly lower than the current price.

4-hour WIF chart: WIF faces resistance at $2.34, with the MACD turning bullish. Support lies around $2.22, with further backing from the 99-SMA at $2.07.
The MACD on the 4-hour chart is showing a stronger bullish signal compared to the 1-hour timeframe. The MACD line is comfortably above the signal line, and the histogram is increasing in size, suggesting growing bullish momentum. This aligns with the idea that WIF might be gearing up for a breakout if it can clear the $2.34 resistance level.
However, there’s a caveat: volume remains moderate. While the price action is trending upward, significant increases in volume are needed to confirm that this isn’t just a temporary rally. Traders should remain cautious if volume fails to pick up, as low liquidity could lead to sudden price swings.
Key Levels to Watch: Support and Resistance
- Support: The immediate support sits at $2.22, where the 7-SMA on the 4-hour chart provides short-term stability. If WIF falls below this, the next support level is the $2.05 zone, which served as the recent bottom.
- Resistance: WIF faces stiff resistance at $2.34. If it can break above this level, the next target would be $2.50, followed by $2.60, marking potential areas where traders might take profit.
Until WIF breaks above $2.34, we are likely to see the price consolidate in a tight range between $2.20 and $2.30. A failure to break resistance could lead to a retest of lower support levels.
Market Sentiment and Trends
The overall market sentiment for Wifiswap seems cautiously optimistic. WIF has benefited from the recent altcoin rally, with many smaller tokens gaining ground as Bitcoin and Ethereum consolidate. However, meme and speculative tokens like WIF can experience rapid price shifts based on market sentiment, meaning that traders should always be prepared for volatility.
In terms of recent trends, WIF has seen increasing attention due to developments around its decentralized exchange platform. The team behind Wifiswap is continuously expanding its ecosystem, which has attracted interest from both retail traders and larger investors. Still, as with many altcoins, liquidity remains a key concern, and sudden sell-offs can lead to dramatic price fluctuations.
Trading and Investment Strategies
Short-Term Traders: Look for a Breakout Confirmation
For short-term traders, the strategy is straightforward: watch for a breakout above the $2.34 resistance level. If WIF can break this key level with increased volume, it could open the door for a rally toward $2.50 or higher. In this case, setting tight stop-losses below $2.22 would be wise to manage the risk of a sudden reversal.
The MACD on both the 1-hour and 4-hour charts shows bullish momentum, but the volume needs to increase to confirm this trend. Traders should look for volume spikes as a signal to enter long positions, and consider scaling out of the trade near $2.50 to lock in profits.
Long-Term Investors: Accumulate on Dips
For long-term investors, WIF is showing positive signs of recovery from its recent lows, making this a good opportunity to start accumulating. If you believe in the future of the Wifiswap ecosystem and its potential growth, now could be an ideal time to buy on dips, especially if WIF pulls back to the $2.05 or $2.20 levels.
A dollar-cost averaging (DCA) strategy could help long-term investors take advantage of price fluctuations without trying to time the market perfectly. As always with altcoins, it’s important to allocate only what you’re willing to risk, as these tokens can be subject to extreme volatility.
Conclusion: WIF at a Crucial Juncture
WIF is trading at a critical resistance level of $2.34. A breakout above this level could send the token soaring toward $2.50 or higher, while a failure to break through may result in a pullback to the $2.20 or even $2.05 support levels. Short-term traders should wait for confirmation of a breakout before entering positions, while long-term investors can consider accumulating during dips if they believe in the project’s future growth.
As always, careful risk management is essential, especially when trading lower-cap tokens like WIF, which are prone to sudden price swings. For more in-depth analysis and daily trade tips, follow my blog on Binance Square. Stay updated with the latest market trends and insights at Binance Square.


