Troy (TROY) has been showing some intriguing price action lately, with indicators suggesting potential opportunities for both short-term traders and long-term investors. Let’s dive into the chart and explore what this cryptocurrency has in store for us.
Chart Analysis: Key Levels and Indicators
Timeframe: The analysis is based on a 4-hour chart for TROY, which provides an intermediate view, balancing short-term fluctuations and broader price trends.
Moving Averages (MA)
• The 7-period moving average (MA) is currently sitting at 0.001302, closely tracking recent price movements. This suggests that the price is attempting to stabilize after a recent surge.
• The 25-period MA is at 0.001317, aligning closely with the short-term average, indicating consolidation around these levels.
• The 99-period MA stands at 0.001443, which serves as an overhead resistance level. If the price moves above this average with strong momentum, it could signal a potential breakout.
The price recently tested the 99-period moving average and faced rejection, leading to a slight pullback. However, if TROY can gain momentum and break through this level, it could pave the way for a significant upside move.
MACD (Moving Average Convergence Divergence)
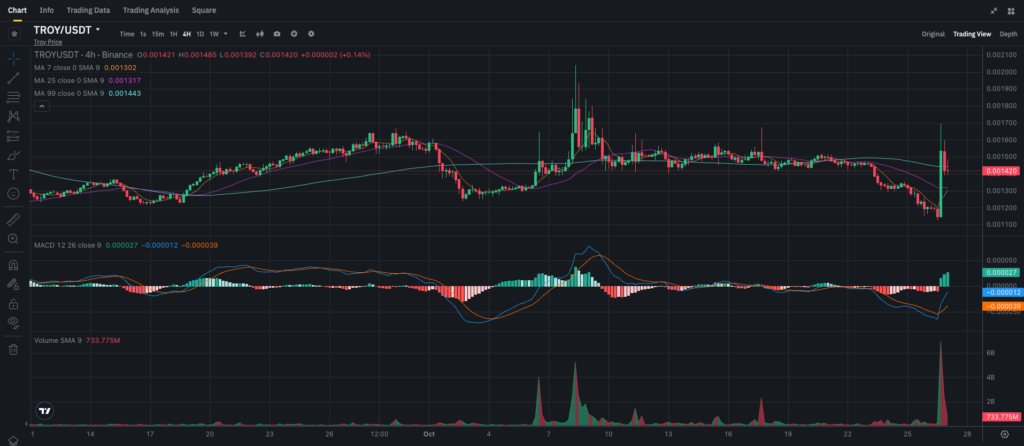
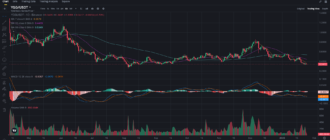
The 4-hour chart shows TROY testing resistance at the 99-period MA, with MACD indicating mild bullish momentum and key support around the 0.001300 level.
The MACD shows a mild bullish crossover, with the blue MACD line (0.000027) crossing above the orange signal line (0.000012). This crossover typically indicates growing bullish momentum. However, the signal remains weak as the MACD bars are still in a recovery phase. To confirm a strong trend reversal, traders should wait for a consistent increase in MACD histograms above the zero line.
Support and Resistance Levels
• Immediate Resistance: The most recent resistance level is at 0.001443, marked by the 99-period MA. This level is critical for the price to break if TROY is to continue its upward trajectory.
• Secondary Resistance: Beyond 0.001443, the next significant level to watch is 0.001700, which was tested during the recent spike but failed to hold. If TROY reattempts and surpasses this level, it could be a bullish signal.
• Immediate Support: Support lies at 0.001300, aligning with both the 7 and 25-period moving averages. This level is important for maintaining bullish momentum. Should the price dip below, it could signal a short-term bearish trend.
• Secondary Support: The next support level is at 0.001200. A break below this might indicate a return to bearish sentiment, especially if trading volume increases.
Trading Volume Insights
Volume spikes can provide insight into market sentiment. On the 4-hour chart, we observe a notable increase in volume during the price rise, which indicates strong buying interest. However, the volume has since dropped, suggesting caution among traders as TROY approaches its resistance levels. If the volume picks up again while the price tests resistance, it might be a bullish indicator, implying that buyers are ready to push the price higher.
Recommendations for Traders
For Short-term Traders
If you’re trading TROY in the short term, watch for the price to test and break above the 99-period MA at 0.001443. If this happens with increasing volume, it may present an opportunity to open long positions. Consider placing a stop loss below 0.001300 to mitigate risks if the price faces rejection and pulls back.
If the price falls below 0.001300, short-term traders could look for shorting opportunities, aiming for the 0.001200 level as the next target. Again, monitoring volume is key, as a low-volume drop may suggest a temporary correction rather than a sustained downtrend.
For Long-term Investors
Long-term investors might want to wait for confirmation of the breakout above 0.001443 before committing more capital. If TROY breaks this level and maintains support, accumulating during retracements could be a viable strategy, as it indicates growing market confidence. Alternatively, if the price dips towards the 0.001200 level, it might present a good buying opportunity for those looking to build long-term positions, especially if supported by an increase in trading volume.
Price Prediction: What’s Next for TROY?
If TROY successfully breaks above the 0.001443 resistance level, we could see it targeting the 0.001700 level again, which was a previous high. A move beyond 0.001700, backed by strong volume, might open the door for further gains, possibly towards the 0.002000 range in the coming weeks.
However, if TROY struggles to maintain above 0.001300, it might suggest a period of consolidation or a downtrend. In such a case, the price could retest the 0.001200 support level. Long-term bullish outlooks would remain intact as long as the price stays above 0.001200, where buyers may reenter the market.
Final Thoughts
TROY’s current setup offers opportunities but comes with caution. The movement around the 99-period MA will be critical in determining the next direction. As always, traders and investors should practice risk management and stay updated on the latest market movements.
For more detailed analysis and updates on TROY and other cryptocurrencies, follow my blog on Binance Square and join my Telegram channel to stay informed!

