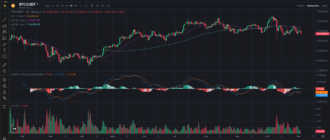
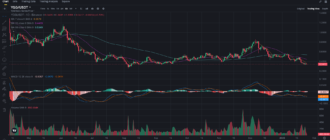
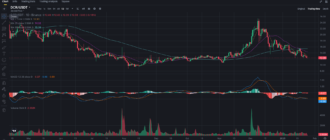
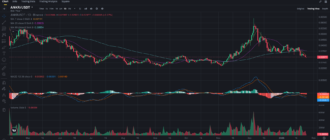
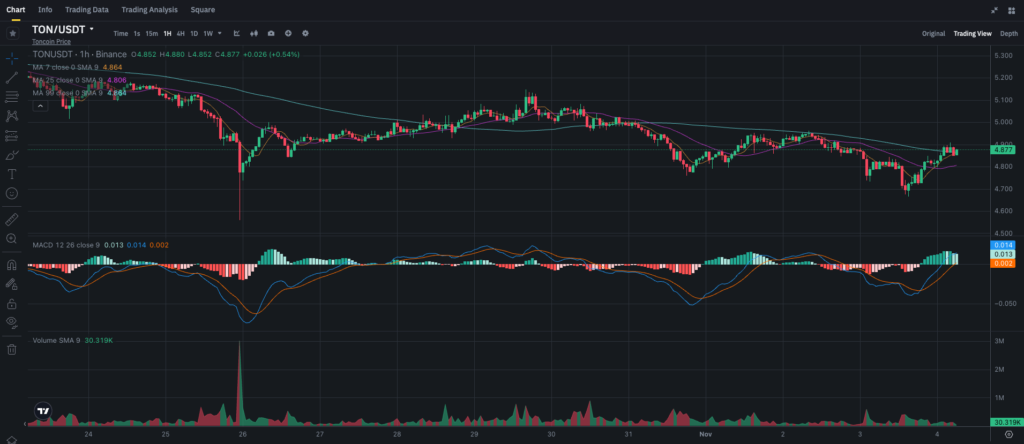
Toncoin (TON) has seen notable price movement in recent days, with the current chart suggesting a battle between bullish momentum and persistent resistance. As of now, TON is trading around 4.877 after experiencing a modest recovery from its recent lows. In this analysis, we’ll dive into the technical signals to explore the potential short-term trajectory of TON, focusing on support and resistance levels, moving averages, MACD, and volume trends.
Recent Price Movement
Toncoin has been in a period of consolidation, following a drop from the 5.300 level at the end of October. The token has faced resistance near 5.000, repeatedly failing to break through. However, the recent uptrend indicates that buyers are re-entering the market, bringing TON closer to testing its resistance levels once again. The question now is whether TON can sustain this rally or if it’s due for a correction.
Technical Indicator Analysis
Simple Moving Averages (SMA)
• 7-Period SMA: Currently sitting at 4.864, the 7-period SMA is just below TON’s current price. This SMA has recently shifted to a more bullish slope, suggesting growing support in the very short term. If TON stays above this level, it could serve as a foundation for further gains.
• 25-Period SMA: The 25-period SMA at 4.806 is also trending slightly upwards and now lies beneath the price, reinforcing the 7-period SMA as a support level. These two short-term averages show that bullish sentiment is building momentum.
• 99-Period SMA: Positioned at 4.864, the 99-period SMA aligns with the 7-SMA and represents a long-term resistance level. For TON to confirm an extended upward trend, it would need to close above this SMA consistently.
MACD (Moving Average Convergence Divergence)
The MACD shows signs of an emerging bullish crossover, as the MACD line is above the signal line, and the histogram has shifted to positive territory. While this is a good indication of short-term upward momentum, the gap between the MACD and signal line is narrow, suggesting that the bullish momentum is not yet strong. A wider gap or a sustained positive histogram would provide more confidence in the upward trend.
Volume Analysis
Volume has been relatively stable in recent sessions, without significant spikes that would indicate a major shift in buying or selling pressure. The Volume SMA (9) sits around 30.319K, showing modest trading interest. For a breakout above resistance levels, TON would ideally need a substantial increase in volume, which would confirm heightened interest and buying power from market participants.
Key Support and Resistance Levels
• Support Levels:
• Immediate Support: 4.864 (7-SMA and 99-SMA). TON’s price sitting above this level is essential for maintaining the current bullish setup.
• Secondary Support: 4.800 (25-SMA). If TON falls below this level, it could trigger a short-term sell-off, testing the resilience of current buyers.
• Resistance Levels:
• Immediate Resistance: 4.900. This level has acted as a resistance barrier recently. A breakout above 4.900 could open the path to higher levels.
• Key Resistance: 5.000. Breaking this psychological level would signal a shift in market sentiment and could attract new buyers, potentially driving TON toward higher targets like 5.200.
Market Sentiment and Broader Trends
Toncoin’s price action seems to reflect cautious optimism in the crypto market, with the token attempting a rebound from recent lows. The broader market’s sentiment remains mixed, with some coins experiencing gains, while others face downward pressure. TON’s recent upward trend may be a result of increasing interest in its use cases and the broader blockchain landscape, but its ability to maintain this trajectory will likely depend on overall market conditions and any significant developments in the crypto space.
Trading and Investment Strategies
For Short-Term Traders
Short-term traders should closely monitor the 4.900 resistance level. A breakout above this level with increased volume would present an opportunity for a quick long position, with a target around the 5.000 level. However, if TON fails to break 4.900, it may be wise to wait for a retracement closer to the 4.800 support level before re-entering. Setting stop-losses just below the 4.800 mark can help mitigate risk in the event of a sudden downturn.
For Long-Term Investors
For long-term investors, TON’s current range offers an interesting entry point, particularly if it continues to hold above the 4.800 support. Accumulating positions at or near this level could provide value if the token resumes a broader upward trend. Dollar-cost averaging (DCA) may be a beneficial strategy here, allowing investors to build their positions gradually without being overly exposed to short-term volatility.
Price Prediction
If TON can break above the 4.900 resistance with substantial buying volume, the next likely target would be 5.000, a level that could act as a strong psychological resistance. Beyond this, if bullish momentum continues, TON could aim for 5.200 in the medium term. Conversely, failure to hold above 4.800 could bring TON down to test lower support levels, possibly revisiting 4.700 or lower.
Conclusion
Toncoin is at a crucial point, facing immediate resistance at 4.900 and key support at 4.800. Short-term traders may find opportunities by waiting for a breakout or pullback confirmation, while long-term investors might consider accumulating near the current support levels. As always, careful risk management is essential, especially given the broader volatility in the crypto market.
To stay updated with the latest analysis on Toncoin and other cryptocurrencies, follow my blog on Binance Square here and join my Telegram channel here for more insights.

