TNSR (Tensor) is making waves in the crypto market, and all eyes are on its recent price action. The 4-hour chart shows promising signs, and with the right strategy, traders could capitalize on this momentum. Let’s dive into the technical analysis to understand what’s happening with TNSR and what it means for traders and investors alike.
Chart Analysis: Bullish Momentum Picking Up
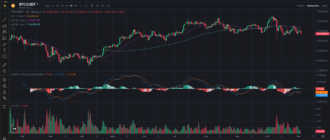
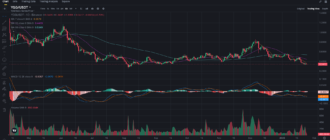
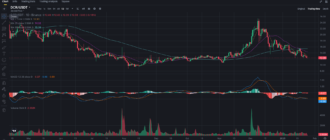
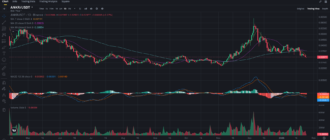
On the 4-hour chart, TNSR has surged to $0.4784, showing a clear uptrend after a period of consolidation around the $0.4200 level. The moving averages (MAs) are signaling a strong bullish trend. The 7-period MA has crossed above both the 25-period and 99-period MAs, confirming the upward trajectory. Such alignment typically indicates that short-term buyers are active and the price could move higher if the momentum continues.
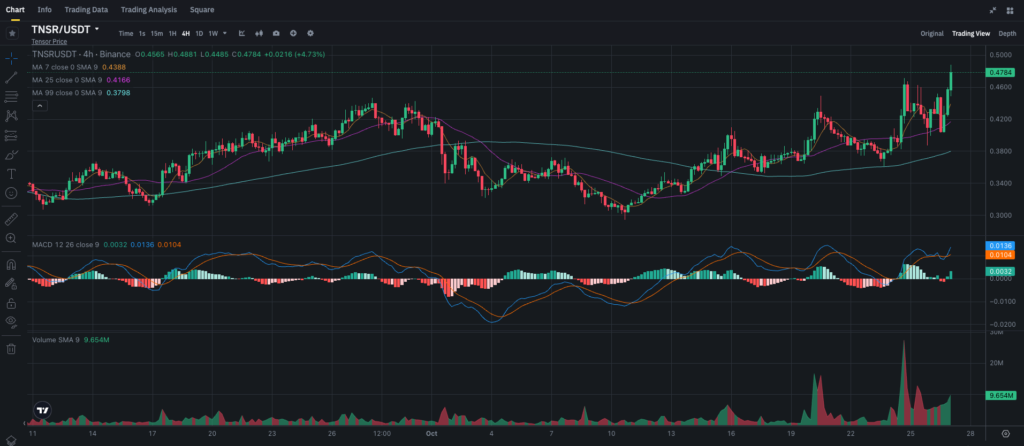
Volume has also increased significantly as TNSR broke above the $0.4500 mark, suggesting growing interest among traders. This level now serves as support, and it will be critical to see whether it holds if the price retests this zone.
MACD Indicator: Momentum Confirmation
The MACD (Moving Average Convergence Divergence) offers further insights into the ongoing bullish trend. The MACD line has crossed above the signal line, and the histogram shows positive green bars, indicating rising momentum. However, traders should keep an eye on this indicator; if the histogram starts to decrease, it could be an early signal of weakening momentum, leading to a possible pullback.
Key Levels to Watch: Support and Resistance
Understanding the crucial support and resistance levels is vital for managing risk and making informed trading decisions:
• Resistance Level: $0.5000 – This is both a psychological and technical barrier. If TNSR manages to break above this level with high volume, it could open the door for further gains.
• Support Level: $0.4500 – This level has become an essential support zone. If the price pulls back, holding above $0.4500 would be a positive sign for the continuation of the uptrend.
Trading and Investment Recommendations
Based on the current technical analysis, here are tailored strategies for both short-term traders and long-term investors:
Short-Term Traders
For those looking to capitalize on TNSR’s short-term movements, watch the $0.5000 resistance level closely. If the price breaks above this level with strong volume, it could be a good opportunity to enter a long position, targeting higher levels such as $0.5500. Set a stop-loss just below the $0.4500 support to manage risk in case of a sudden drop.
On the flip side, if the price gets rejected at $0.5000, it might be wise to wait for a pullback toward the $0.4500 support zone before entering a position.
Long-Term Investors
Long-term investors should monitor these developments with caution. If TNSR pulls back to the $0.4500 level and shows signs of consolidation, it may present a favorable opportunity to accumulate. Conversely, a confirmed breakout above $0.5000 could also justify buying into strength, as it would indicate a potential trend continuation.
Price Prediction: Where Could TNSR Go Next?
Given the current setup, if TNSR successfully breaks above the $0.5000 resistance, we could see the price move up to $0.5500 in the short term. A sustained break above this level could even push TNSR toward the $0.6000 mark. However, if the price struggles to hold above $0.5000 and falls back, expect consolidation around the $0.4500 zone before any major move.
Final Thoughts: Time to Watch Key Levels Closely
TNSR is showing strong bullish signals, but as always in crypto, vigilance is essential. For short-term traders, the $0.5000 level will be crucial. A breakout could mean further gains, while a rejection could signal a pullback. For long-term investors, patience is key—accumulating on dips or buying after a confirmed breakout are both viable strategies.
If you want more insights like this and to stay ahead of the market, follow my blog on Binance Square. You can also join my Telegram channel for real-time updates and community discussions!

