SUN is a token whose market history is defined by sharp but short-lived bursts of activity. In previous cycles, the price repeatedly showed explosive upside moves followed by long periods of decline and consolidation. Heading into 2026, SUN comes off a vivid speculative spike that faded just as quickly, making the price forecast for 2026 highly dependent on whether market interest and volume can return. Current price action looks more like a market trying to regain balance after excess rather than one preparing for immediate growth.
SUN technical analysis: daily chart and market structure
This technical analysis is based on the 1D timeframe. The latest completed candle is February 3, 2026, 02:00 UTC. On the daily chart, SUN remains in a descending structure, with a clear sequence of lower highs and lower lows formed after the sharp rally seen in early autumn.
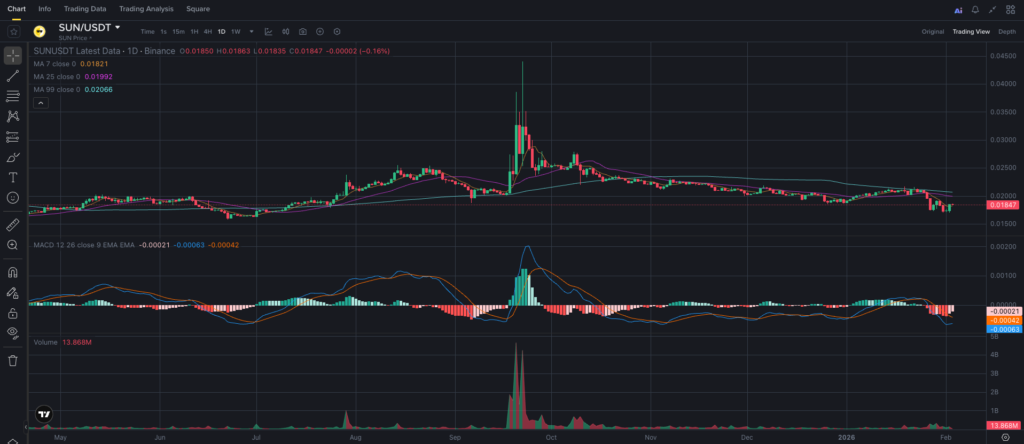
That vertical price expansion marked the climax of the move, followed by an equally fast reversal. Since then, SUN has gradually drifted lower, failing to establish new highs and effectively retracing back toward pre-pump levels. The current structure suggests the market is still digesting the aftermath of that impulse.
Support and resistance levels for SUN
The primary support zone sits around $0.0180–0.0185, where price is consolidating at the start of 2026. This area has repeatedly absorbed selling pressure, confirming its technical relevance.
If this support fails, the next downside reference lies near $0.0150–0.0160, a zone that previously acted as a base before the impulsive breakout. On the upside, immediate resistance is found around $0.0205–0.0215, aligned with recent pullback highs. A stronger supply zone appears higher at $0.0250–0.0270, where heavy selling followed the peak move.
Moving averages and trend dynamics
The chart uses MA 7, MA 25, and MA 99. Both short- and medium-term averages remain below the long-term MA(99), and their slopes are moderately negative. This configuration reflects continued bearish control on a medium-term basis.
During the impulsive rally, shorter averages briefly crossed to the upside, but those signals proved temporary and were quickly invalidated. A structural shift would require sustained price action above MA(99), something the market has not yet achieved.
MACD and volume: momentum assessment
MACD remains below the zero line, with the MACD line positioned under the signal line. The histogram shows modest but expanding negative values, pointing to renewed downside momentum after a short pause.
Volume surged aggressively during the breakout phase, then collapsed just as quickly. In recent months, trading activity has stayed subdued and consistent, a typical sign of fading speculative interest and the absence of strong catalysts.
Short-term price scenario for SUN
If price holds above the $0.0180–0.0185 support zone, SUN may continue to trade sideways with attempts to test $0.0205. This would resemble a consolidation phase following a sharp impulse. A decisive break below support would increase the likelihood of a move toward $0.0150. As long as price remains below key resistance levels, upside moves appear technical and limited in scope.
SUN price prediction for 2026: scenario-based outlook
The base-case scenario for 2026 places SUN in a broad range between $0.028 and $0.040. This outcome becomes plausible if market conditions stabilize, interest in the ecosystem improves, and price reclaims levels above the $0.025 area.
A more optimistic scenario allows for expansion into the $0.055–0.070 range. This would likely require renewed speculative appetite, rising volumes, and supportive narrative-driven catalysts.
The bearish alternative scenario envisions continued pressure and price action within $0.012–0.016, should current support fail and broader market conditions remain unfavorable.
Factors that could influence SUN’s price in 2026
In recent months, market participants have focused more closely on ecosystem resilience and genuine user activity. For SUN, infrastructure development, community engagement, and the broader smart contract environment play a critical role.
Macro conditions, regulatory trends, and overall risk appetite in digital assets also matter. Any developments capable of restoring visibility or relevance to the project could act as short-term price drivers.
Trading vs investing: how the market may interpret the current setup
SUN currently trades as a post-spike asset transitioning into stabilization. Volatility has dropped significantly from peak levels, and momentum remains muted.
Short-term traders typically monitor reactions around established support and resistance, paying close attention to failed breakouts and volume behavior. False moves and fading momentum often define this phase.
Long-term investors may view 2026 as a period to reassess recovery potential, waiting for structural confirmation before assigning higher conviction to the asset.
Final thoughts on SUN’s outlook for 2026
SUN enters 2026 after a sharp speculative episode followed by prolonged cooling. While the technical picture remains cautiously bearish, signs of stabilization are emerging. Any meaningful recovery will depend on renewed volume and sustained market interest. Under supportive conditions, upside scenarios remain possible, though downside risks cannot be ignored. SUN remains available on major exchanges such as Binance, Bybit, and HTX.