Chart Overview and Current Market Status
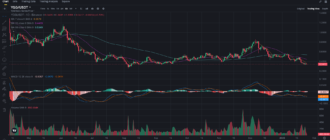
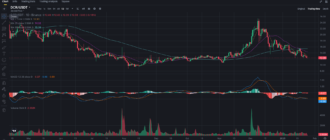
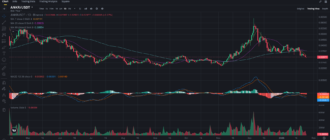
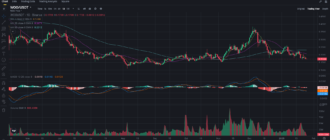
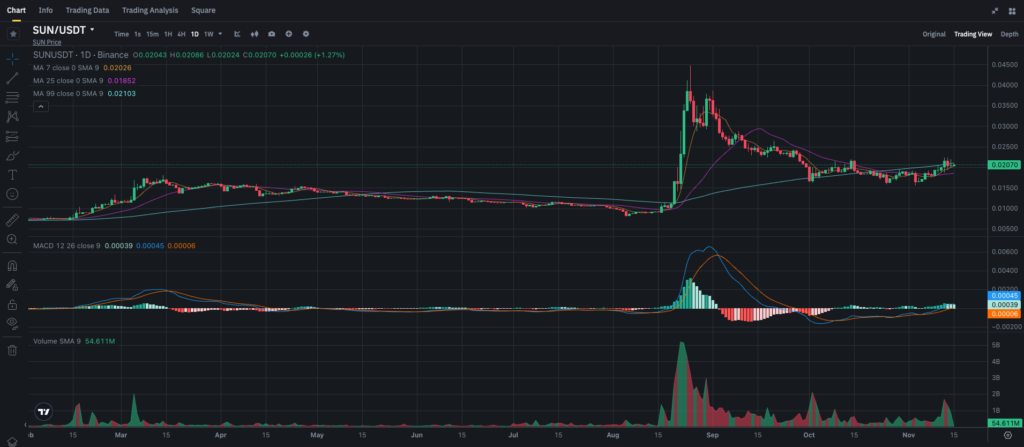
The daily chart for SUN indicates a period of significant volatility, especially around September when the token experienced a sharp rally followed by a quick retracement. Currently, SUN is trading near $0.0207, showing some stabilization after a recent gradual increase. Key technical indicators and moving averages suggest that SUN might be gearing up for another move, but the direction remains uncertain as the market consolidates.
Key Support and Resistance Levels
Identifying strong support and resistance levels helps in predicting potential price actions and setting target zones:
- Immediate Support: $0.0185 – A key level near the 25-day moving average, which has provided recent support.
- Major Support: $0.015 – Aligned with the 99-day moving average, a drop to this level could suggest a prolonged bearish trend.
- Immediate Resistance: $0.022 – If SUN breaks above this level, it could indicate renewed bullish momentum.
- Major Resistance: $0.028 – This level aligns with previous peaks and could serve as a significant hurdle for further upside movement.
These levels offer critical reference points for traders, with $0.022 and $0.028 acting as resistance zones and $0.0185 and $0.015 providing support in the event of downward movement.
Moving Averages (MA) Analysis
The moving averages give insight into the overall trend and potential price behavior in the short, medium, and long term.
- 7-day MA (Short-Term): Positioned at $0.0202, slightly below the current price. If SUN continues to stay above this level, it may indicate bullish short-term momentum.
- 25-day MA (Medium-Term): Positioned at $0.0185, this moving average has acted as a support level in recent days. Holding above this level could attract more buyers and boost confidence in the bullish trend.
- 99-day MA (Long-Term): Currently around $0.0210, this average suggests a critical threshold for SUN. Staying above the 99-day MA would indicate a long-term trend shift, potentially attracting long-term investors.
The 7-day moving average moving closer to the price shows potential upward momentum, while staying above the 25-day MA and the critical 99-day MA could solidify a bullish trend for SUN in the coming weeks.
MACD Analysis
The MACD (Moving Average Convergence Divergence) provides additional insights into the momentum and potential direction of SUN’s price movement.
- MACD Line: The MACD line has crossed above the Signal line, indicating a bullish crossover. This is a positive signal that could lead to increased buying interest if the momentum sustains.
- Histogram: The histogram shows small but gradually increasing green bars, suggesting a potential buildup in positive momentum. This aligns with the price holding near the $0.020 mark.
The MACD suggests a growing bullish sentiment, and if the MACD line continues to move above the Signal line with a widening gap, it could confirm stronger upward momentum for SUN.
External Market Factors and News Influences
Market Sentiment and Altcoin Performance
As an altcoin, SUN is highly sensitive to the broader cryptocurrency market and altcoin trends. Recently, some recovery in altcoin interest has been observed, driven by renewed optimism in the crypto sector. Positive developments in the larger market, like Bitcoin’s upward movement, may benefit SUN as well by drawing more investors toward alternative tokens.
Project-Specific Developments
Project-specific news related to SUN, especially regarding its connection with the TRON network, could play a role in boosting or dampening market sentiment. SUN, as part of the TRON ecosystem, may gain attention if there are upgrades or collaborations within the network, as these often lead to speculation and increased trading volume. Monitoring such announcements is crucial for SUN investors.
Price Forecast and Potential Scenarios
Based on the analysis above, SUN’s price movement could take several directions:
- Bullish Scenario: If SUN manages to break above the immediate resistance at $0.022 with strong volume, it could target the $0.028 level. A breakout above this major resistance might spark further bullish momentum, potentially leading to a longer-term rally.
- Neutral Scenario: If SUN remains between $0.0185 and $0.022, it might be in a consolidation phase. This sideways movement could indicate a wait-and-see approach by the market, with traders awaiting clearer signals before making substantial moves.
- Bearish Scenario: If SUN falls below the $0.0185 support level, it could retest the $0.015 mark, aligning with the 99-day MA. A drop below this critical level would signal a bearish trend, possibly leading to further declines as investor sentiment wanes.
Trading and Investment Insights
For Short-Term Traders
Short-term traders might consider an entry if SUN breaks and holds above $0.022 with rising volume. Setting a stop-loss slightly below $0.0185 could manage risk in case of a bearish reversal. If SUN pushes past $0.022, potential profit-taking levels may be around $0.025 to $0.028.
If SUN struggles to break resistance at $0.022, short-term traders could adopt a more cautious stance, potentially waiting for a stronger breakout signal before committing.
For Long-Term Investors
Long-term investors might see SUN’s ability to hold above the 99-day MA at $0.021 as a positive sign for accumulation. Accumulating at or near support levels like $0.0185 and $0.015 could offer favorable entry points. However, investors may want to monitor any bullish developments within the TRON ecosystem, as these could impact SUN’s potential for a sustained uptrend.
Conclusion
SUN currently shows potential for upward movement, especially with recent bullish signals from the MACD and moving averages. However, significant resistance levels at $0.022 and $0.028 need to be broken for SUN to confirm a stronger bullish trend. Investors and traders should watch these levels closely and stay updated on broader market conditions and developments within the TRON ecosystem.
SUN is available for trading on Binance in a USDT pairing, making it accessible for both short-term traders and long-term investors. Binance


