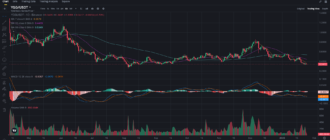
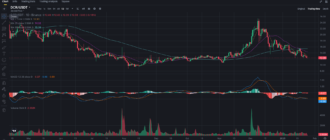
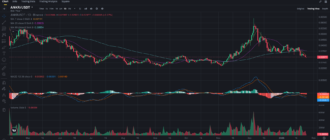
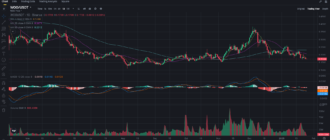
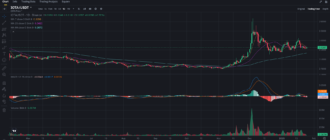
Sui (SUI) has been on a steady rise recently, drawing attention from both short-term traders and long-term investors. The 4-hour chart shows a consistent uptrend with higher lows, but the latest candlestick movements suggest that a period of consolidation or even a slight retracement could be on the horizon. In this blog, we’ll break down SUI’s chart, highlight key levels of support and resistance, and offer actionable insights for both short-term and long-term players in the market.
What’s Behind the Recent Rise of SUI?
Several factors could be contributing to the recent rise in SUI’s price. The broader cryptocurrency market has seen a resurgence in optimism, and SUI has benefited from the general trend of increased interest in layer-1 blockchain solutions. While no major fundamental news specific to SUI has been the catalyst, technical traders have driven the price based on breakout patterns and sustained bullish momentum.
SUI Technical Analysis

Key Support and Resistance Levels
- Resistance at $2.15: SUI has struggled to break above this level in the past few days. The rejection from this area suggests that bulls are starting to face some opposition. If SUI manages to break through, we could see a quick rally to the next resistance level at $2.30 or even higher.
- Support at $2.00: The current price action shows that $2.00 is holding as a strong support. The 99-period SMA is also hovering around this level, providing additional technical backing for this support zone.
- Major Support at $1.85: Should SUI break below $2.00, a drop to $1.85 could be in the cards. This is a critical level that coincides with the 25-period SMA and would likely attract buying interest from long-term investors looking to enter at a lower price.
Moving Averages: Signs of Continued Upward Momentum
The 7-period SMA is sitting at 2.14, while the 25-period SMA is at 2.07, both slightly below the current price, signaling that the shorter-term trend remains positive. The 99-period SMA is positioned at 2.02, serving as a long-term bullish indicator. The alignment of these moving averages suggests that SUI is still in an uptrend, although it might be nearing a period of consolidation before another leg higher.
MACD: Bullish but Flattening
The MACD indicator is currently showing bullish momentum, with the MACD line at 0.0089 above the signal line at 0.0066. However, the histogram is relatively flat, indicating that the strength of the bullish trend may be waning. Traders should monitor for a potential bearish crossover, which could signal the beginning of a pullback or a sideways movement in the near term.
Volume: Decreasing Participation
Volume has been decreasing slightly in recent sessions, with the 9-period SMA at 7.84M. While the recent price rise is still being supported by buyers, the decreasing volume could suggest that the bullish momentum may slow down. If volume doesn’t pick up soon, a short-term correction or a consolidation phase might be in store.
Trading Strategies for SUI
Short-Term Traders:
- Look for a Breakout Above $2.15: If SUI breaks above $2.15 with conviction, it could signal a continuation of the uptrend. Short-term traders might consider entering on a breakout, aiming for a target around $2.30 with a stop-loss set near $2.00.
- Consider Taking Profits at $2.10: If SUI fails to break resistance at $2.15, short-term traders could consider taking profits around the $2.10 level to secure gains. A failure to break this resistance could lead to a retest of $2.00 or even $1.85.
Long-Term Investors:
- Accumulate Near $2.00 or Below: Long-term investors might consider buying more SUI near the $2.00 support level or even below if a deeper correction occurs. The long-term moving averages and bullish momentum suggest that SUI could be a solid hold for investors looking to capitalize on future growth.
- Hold Through Short-Term Volatility: If you’re already holding SUI, it may be worth weathering any short-term corrections, as the overall trend remains positive. Expect some choppiness, but a move toward $2.30 and beyond is still in play if market conditions remain favorable.
Price Prediction for SUI
Considering the current chart setup, SUI looks poised to test $2.15 resistance again. If it manages to break through, the next target would likely be $2.30, with a possible extension toward $2.50 in the coming weeks if buying pressure continues. However, if SUI fails to maintain its momentum and breaks below $2.00, a deeper correction toward $1.85 is possible before buyers step back in.
If broader market sentiment remains positive and SUI can maintain its bullish structure, we could see it hit $2.30 to $2.50 by the end of the month. However, a failure to break key resistance levels could lead to a retest of lower support levels in the $1.85 to $2.00 range before any further upside.
Conclusion: What’s Next for SUI?
SUI has shown remarkable strength over the past weeks, but now it’s approaching a critical juncture. Traders should be cautious around the $2.15 resistance, as a failure to break this level could lead to a pullback. However, long-term investors should remain confident, as the broader trend still points upward.
Whether you’re trading short-term price movements or investing for the long haul, SUI offers intriguing opportunities right now. Just remember to stay disciplined, manage your risk, and keep an eye on those key support and resistance levels.
To stay updated on the latest market analysis, follow my blog on Binance Square and join my Telegram channel for more detailed crypto insights.


