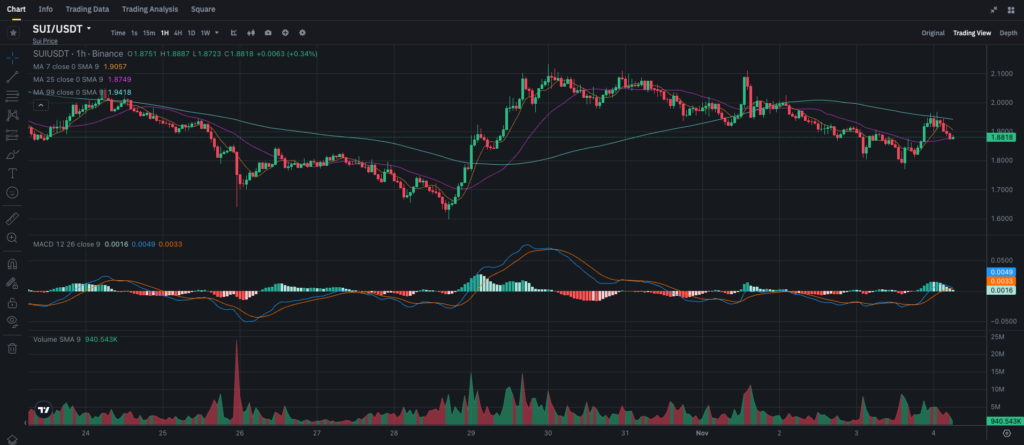
Sui (SUI) has been in the spotlight recently as it oscillates between resistance and support levels, testing the patience of traders. The token is currently trading around 1.8818, and its recent price action reveals the struggle between bulls and bears to control the market’s direction. In this analysis, we’ll dive into SUI’s technical indicators, current price trends, and potential trading strategies to help you navigate the next steps in this token’s journey.
Recent Price Movement
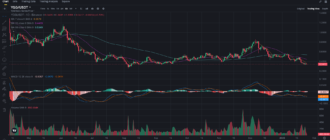
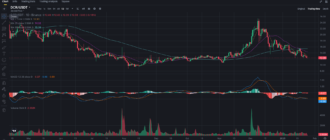
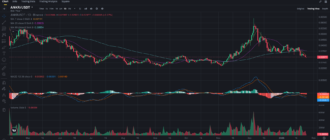
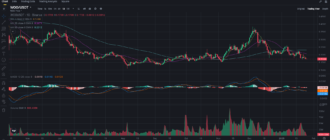
SUI has been showing mixed signals, trading within a volatile range over the past week. After hitting a low near 1.70, the token managed to bounce back and reclaim the 1.90 level but has struggled to maintain upward momentum. The recent decline from above 2.00 indicates that selling pressure is building, but buyers are stepping in near the 1.85 support area. The question now is whether SUI can muster enough bullish power to break through key resistance or if it will remain range-bound.
Technical Indicator Analysis
Simple Moving Averages (SMA)
• 7-Period SMA: The 7-period SMA is currently positioned at 1.9057, just above SUI’s current trading price. This SMA has acted as a resistance level, as SUI has repeatedly failed to break above it in recent sessions. If SUI can close above this SMA, it may signal a potential shift in short-term momentum toward the bulls.
• 25-Period SMA: The 25-period SMA sits at 1.8749, very close to the current price, suggesting a zone of consolidation. This SMA provides short-term support, and a breakdown below it could expose SUI to further downside risks.
• 99-Period SMA: Positioned at 1.9418, the 99-period SMA is a key resistance level. A break and close above this SMA would be a strong indicator of renewed bullish strength, possibly allowing SUI to target higher resistance levels around 2.00.
MACD (Moving Average Convergence Divergence)
The MACD currently shows a slight bullish crossover, with the MACD line positioned just above the signal line. This crossover, combined with the positive histogram bars, suggests that buying momentum may be building. However, the MACD’s signal remains relatively weak, indicating that this bullish shift might not be strong enough for a sustained uptrend unless accompanied by an increase in trading volume and a break above the 7-SMA.
Volume Analysis
Trading volume has been moderate, with some notable spikes during the recent price swings. The Volume SMA (9) is currently around 940K, reflecting cautious trading activity. A significant increase in volume, especially during a price breakout above 1.9057, would provide stronger confirmation of a trend reversal or breakout. Conversely, if volume decreases, it could signal a lack of conviction among buyers, potentially leading to a price dip.
Key Support and Resistance Levels
• Support Levels:
• Immediate Support: 1.8749 (25-SMA). This level is crucial for maintaining short-term stability. A break below this support could bring SUI down to test the 1.85 region.
• Secondary Support: 1.70. This recent low level provides a strong base for SUI, and if the price dips further, this is likely where buyers would step in more aggressively.
• Resistance Levels:
• Immediate Resistance: 1.9057 (7-SMA). For SUI to move higher, it needs to break and close above this level, which has been acting as a short-term resistance.
• Key Resistance: 1.9418 (99-SMA). This longer-term SMA is critical, as a breakout above it would suggest a shift in market sentiment and could drive the price toward the 2.00 psychological level.
Market Sentiment and Broader Trends
The general market sentiment around Sui is cautiously optimistic. While the token has shown resilience by bouncing back from recent lows, the ongoing struggle with resistance levels reflects a lack of strong buying conviction. Broader market trends in the cryptocurrency space could also influence SUI’s price trajectory, particularly if Bitcoin and other major cryptocurrencies continue to experience fluctuations. For now, traders should monitor the performance of SUI relative to these broader trends, as any significant shifts in the market could impact SUI’s price movement.
Trading and Investment Strategies
For Short-Term Traders
Short-term traders may want to focus on the 1.9057 resistance level. A confirmed breakout above this level, especially with strong volume, would present a buying opportunity with a potential target near 1.9418 (99-SMA). However, if SUI fails to break above this level and starts to decline, traders could consider short positions or wait for a pullback to the 1.85 support level before re-entering. Setting stop-losses just below 1.85 can help manage risks in case of a rapid downward move.
For Long-Term Investors
For long-term investors, the current price levels around 1.8749 offer a reasonable entry point, particularly if they believe in the long-term potential of the Sui ecosystem. Investors can consider gradually accumulating SUI, especially if it dips below 1.85, as this level has shown buying interest in recent days. Dollar-cost averaging (DCA) might be a suitable strategy to reduce the impact of short-term volatility, allowing investors to build a position in anticipation of future gains.
Price Prediction
If SUI can break above the 1.9057 resistance and hold, the token could target 1.9418, with a potential run to the psychological level of 2.00. A move beyond 2.00 could signal a broader bullish trend, particularly if backed by strong volume. On the downside, failure to hold above 1.8749 (25-SMA) could lead SUI back to the 1.85 support level, or potentially lower to the 1.70 mark in case of increased selling pressure.
Conclusion
Sui is at a pivotal point, balancing between support at 1.8749 and resistance at 1.9057. For short-term traders, watching for a breakout above the immediate resistance or a pullback to support offers potential trading opportunities. Long-term investors may find value in accumulating at these levels, particularly if they anticipate future growth within the Sui ecosystem. As always, risk management remains essential, especially given the current market volatility.
For more in-depth market analysis and daily trade updates, don’t forget to follow my blog on Binance Square and join the conversation on my Telegram channel to stay informed.


