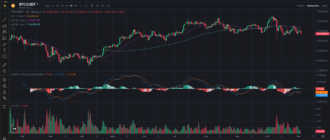
Chart Overview and Current Market Context
SUI, a prominent digital asset, has recently surged in value, trading around $3.26 after an impressive rally from mid-October. This surge marks a significant shift in trend, with SUI breaking key resistance levels and establishing a strong uptrend. The current bullish momentum has pushed SUI well above its major moving averages, reflecting an influx of buying interest. With the MACD and volume indicators aligning with this bullish sentiment, SUI seems primed for further gains, albeit with the potential for short-term corrections. Here’s a closer look at SUI’s technical indicators, key levels, and possible trading scenarios.
Key Support and Resistance Levels

Understanding key support and resistance levels can offer insight into SUI’s immediate price direction:
- Immediate Support: $3.20 – This level, close to the current price, could offer short-term support in case of a minor pullback.
- Major Support: $2.80 – This level marks a more substantial support, providing a buffer if selling pressure increases.
- Immediate Resistance: $3.50 – SUI’s recent rally high; breaking above this could signify continuation of the uptrend.
- Major Resistance: $4.00 – A psychological level that may attract selling interest, potentially slowing the rally.
These levels define SUI’s short-term trading range, with $3.20 and $2.80 offering downside support, while $3.50 and $4.00 serve as key upside targets.
Moving Averages (MA) Analysis
The moving averages reinforce the strength of SUI’s recent uptrend:
- 7-day MA (Short-Term): Positioned at $3.17, this short-term moving average has acted as dynamic support during SUI’s current rally, signaling strong immediate momentum.
- 25-day MA (Medium-Term): Located at $2.31, this moving average now serves as underlying support and reflects the strong bullish trend over recent weeks.
- 99-day MA (Long-Term): At $1.58, the 99-day moving average shows that SUI has decisively broken out of its previous consolidation phase.
With SUI trading above all major moving averages, this confirms a robust bullish trend. Any retracement toward the 7-day MA could offer a buy-the-dip opportunity, while a drop to the 25-day MA may signal a deeper pullback within the ongoing uptrend.
MACD Analysis
The MACD (Moving Average Convergence Divergence) indicator highlights SUI’s bullish momentum:
- MACD Line: The MACD line is well above the Signal line, indicating strong bullish momentum.
- Histogram: The histogram bars are at high levels, confirming the intensity of the buying pressure. However, they are beginning to show signs of narrowing, suggesting that the rally may be slowing.
While the MACD analysis underscores a bullish outlook, the slight narrowing of the histogram indicates a potential cooling-off period. Traders should monitor for any MACD line crossover that might hint at a shift in momentum.
External Market Factors Impacting SUI
Positive Sentiment Toward Layer-1 Solutions
SUI is part of the Layer-1 blockchain ecosystem, which has been garnering significant interest as investors look for scalable blockchain alternatives. Positive news surrounding Layer-1 solutions, network upgrades, or partnerships could further drive SUI’s demand. Investors should monitor developments within the Layer-1 sector as these can have a substantial impact on SUI’s price.
General Market Sentiment
As with many cryptocurrencies, SUI’s price is influenced by the broader sentiment in the crypto market. Increased interest in risk assets or a surge in Bitcoin’s price could have a positive effect on SUI, while broader market corrections could also impact its momentum.
Price Forecast and Potential Scenarios for SUI
Based on the technical indicators, SUI’s price could follow several possible scenarios in the near term:
- Bullish Continuation Scenario: If SUI breaks above the $3.50 resistance level with strong volume, it could target the $4.00 level. A move above $4.00 would likely attract additional buying interest, potentially extending the rally.
- Consolidation Scenario: SUI could stabilize between $3.20 and $3.50, consolidating its recent gains before the next major move. This consolidation phase would allow for a cooling-off period, reducing the likelihood of an overbought correction.
- Pullback Scenario: If SUI falls below the immediate support at $3.20, it may test the $2.80 support level. A break below $2.80 could indicate a deeper correction, though it would still remain within a broader bullish trend as long as the 25-day MA holds.
Trading and Investment Insights
For Short-Term Traders
Short-term traders might consider entering if SUI breaks above $3.50 with increased trading volume, targeting the $4.00 resistance level as a profit point. Setting a stop-loss around $3.20 can help manage risk in case of a sudden downturn. Alternatively, traders may look for a pullback to $3.20 for a lower-risk entry, with potential for gains if SUI rebounds from this support level.
For Long-Term Investors
Long-term investors may see value in accumulating SUI around $3.20 or even down to $2.80, considering the broader bullish trend. Investors focused on SUI’s Layer-1 potential may find these levels attractive for gradual accumulation, especially given the growing demand for scalable Layer-1 solutions. Investors should be prepared for volatility, as SUI may experience swings but could benefit from its strong fundamentals in the long run.
Conclusion
SUI is in a strong uptrend, supported by bullish technical indicators, with support levels at $3.20 and $2.80 and resistance at $3.50 and $4.00. The MACD and moving averages underscore the current bullish momentum, though the recent rapid rise may warrant caution for short-term traders.
SUI is available for trading on Binance in a USDT pairing, providing both trading and investment opportunities.

