The cryptocurrency market has always been full of surprises, and Sui (SUI) is no exception. As we analyze its performance on the charts, it’s evident that SUI has shown a combination of bullish and bearish signals, leaving investors questioning the coin’s next major move. In this article, we’ll break down the technical indicators, support, and resistance levels to provide a clearer outlook for both short-term traders and long-term holders.
SUI’s Current Market Position
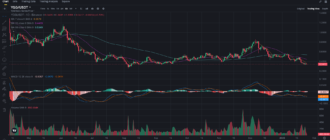
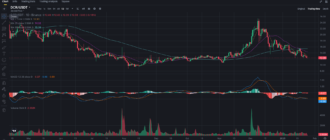
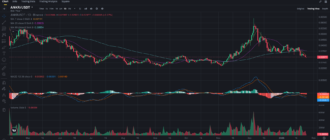
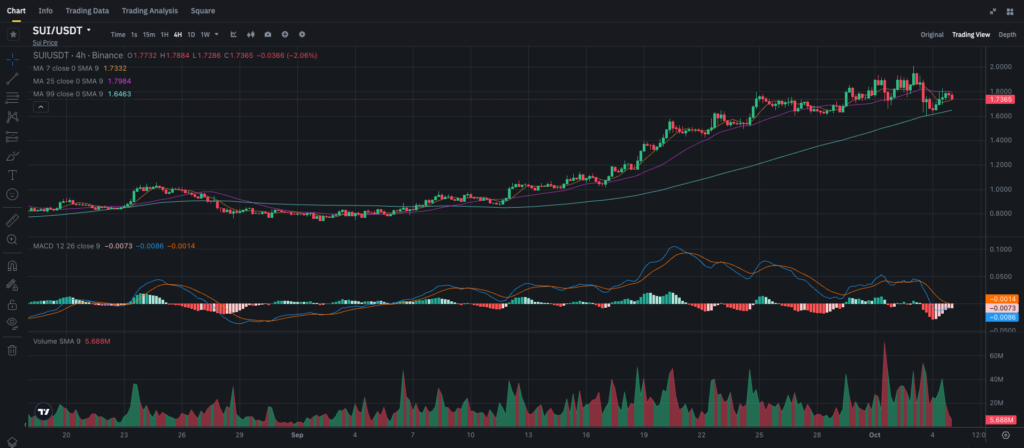
Looking at the 4-hour chart, SUI has been riding a steady upward trend since late August, where the coin started gaining momentum from a low of around $1.20 to reaching a peak near $1.90 by mid-September. This 60% price rally was supported by both moving averages (MAs) and growing trading volumes. However, after hitting the $1.90 resistance level, the momentum slowed down, bringing the price back to the $1.73 level as of October 4.
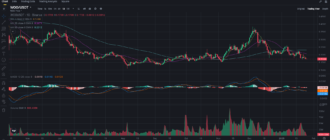
The 1-hour chart shows a shorter-term consolidation phase, where SUI is moving within a narrow range between $1.73 and $1.80. This tight trading band suggests that the coin is building strength before its next significant move.
Key Technical Indicators
Moving Averages (MAs)
- 7-period Simple Moving Average (SMA) on the 4-hour chart is around $1.73, acting as a crucial support level.
- 25-period SMA is sitting at $1.79, close to the current trading price, indicating resistance.
- 99-period SMA lies at $1.64, far below the current price, suggesting that overall momentum is still in favor of the bulls.
On the 1-hour chart, the moving averages paint a more complex picture. Both the 7-period SMA ($1.76) and 25-period SMA ($1.74) are flat, reflecting indecision among traders. However, the 99-period SMA at $1.80 remains a critical point of resistance, which the coin has struggled to break in recent days.
MACD (Moving Average Convergence Divergence)
The MACD on the 4-hour chart shows a bearish crossover, where the signal line is above the MACD line, indicating a possible correction in the near term. The histogram is in the negative zone, suggesting that selling pressure is dominating the market.
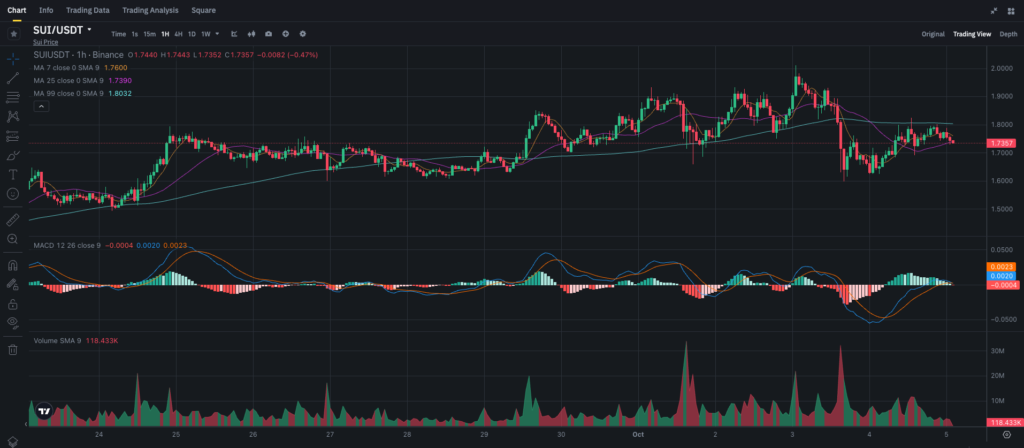
However, the MACD on the 1-hour chart presents a slightly different story, with the MACD line starting to curve back toward the signal line, hinting at a potential bullish divergence. While it’s too early to confirm a reversal, the shift in momentum should be watched closely.
Volume Analysis
Trading volumes on the 4-hour chart have decreased significantly since the end of September, falling from 10M to around 5.6M by October 4. Lower volumes indicate reduced interest or uncertainty among traders, often a precursor to a major move. For now, it seems that the bulls and bears are waiting for a clearer signal before committing to a direction.
Key Support and Resistance Levels
- Support: $1.73 (7-period SMA), $1.64 (99-period SMA)
- Resistance: $1.80 (psychological level), $1.90 (previous peak)
The current range-bound movement of SUI suggests that the coin is consolidating after a strong rally. The $1.73 level is critical; if broken, the next major support lies at $1.64. On the upside, SUI must overcome resistance at $1.80, followed by $1.90 for any substantial rally continuation.
Potential Market Scenarios
Bullish Scenario
If SUI manages to break above $1.80 with increased volume, we could see a push toward the $1.90 resistance, a level it hasn’t reached since mid-September. In this scenario, short-term traders could look for opportunities to open positions near $1.73, targeting $1.90 with a stop loss just below $1.70. For long-term investors, accumulating more at these levels could be wise, as a breakout above $1.90 could signal further bullish momentum, potentially targeting the $2.00 psychological level.
Bearish Scenario
On the other hand, if SUI breaks below the $1.73 support level, it could signal further downside, with the next major support level being at $1.64. For short-term traders, a break below $1.73 might present an opportunity to short the coin, aiming for $1.64 with a stop loss above $1.75. Long-term investors might want to wait for a dip toward $1.64 before adding to their positions.
Neutral/Consolidation Scenario
The current consolidation between $1.73 and $1.80 could continue for a few more days, as traders wait for external factors such as news, market sentiment, or major Bitcoin movements to determine the next direction. During this period, scalping within this range could be profitable for more active traders.
Final Thoughts
SUI is at a pivotal moment, with price action consolidating and the market waiting for a breakout or breakdown. The technical indicators suggest a tug-of-war between bulls and bears, but a clear trend has yet to emerge. As always, the key to success in such market conditions is to manage risk carefully, paying close attention to support and resistance levels.
- For short-term traders, look for a breakout above $1.80 or a breakdown below $1.73 for potential trading opportunities.
- For long-term investors, now may be a good time to accumulate, especially if the price dips toward the $1.64 support level.
Stay tuned to my blog for more updates and real-time analysis. You can subscribe to my Binance Square blog here for daily insights on your favorite cryptocurrencies!


