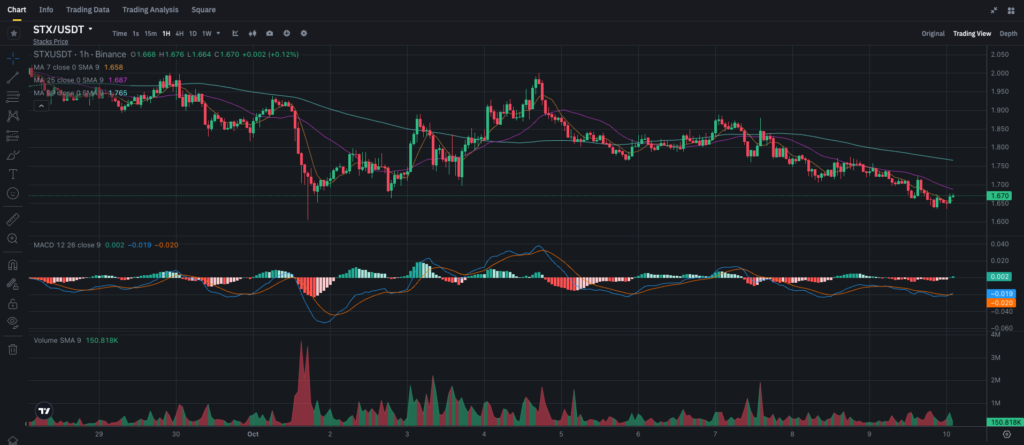
Stacks (STX) has had a tough run recently, with its price action showing a steady decline after a failed attempt to break through the $2.00 level. Currently trading around $1.67, STX is battling to hold onto support levels, but the question remains: Can it recover from here, or is the downtrend too strong to reverse? In this article, we’ll take a close look at the technical analysis of STX and explore what traders and investors can do moving forward.
Support and Resistance Levels for STX
Before diving deeper, let’s identify the key levels of support and resistance that will be crucial for the next price movement.
Support Levels:
- $1.65: This is a strong support level for STX. A break below this could lead to a more significant decline, pushing the price towards the $1.60 level.
- $1.60: A psychological support level that could play a major role in preventing further drops if the price dips below $1.65.
Resistance Levels:
- $1.68: The 25-period moving average sits around this level, creating a resistance zone. If STX can break above this, the next target will be $1.75.
- $1.76: The 99-period moving average is the next hurdle for STX. Reclaiming this level could signal the end of the downtrend and a possible reversal.
Moving Averages: Short-term Bearish, Long-term Uncertainty
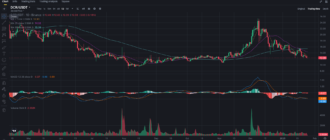
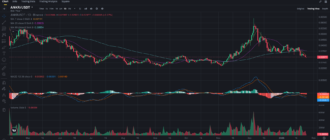
The moving averages paint a mixed picture of the current trend for STX. In the short term, it remains bearish, but the longer-term perspective is more uncertain.
- The 7-period SMA is hovering around $1.65, and the price is slightly above this, indicating that STX is trying to break free from the immediate downward pressure.
- The 25-period SMA sits at $1.68, which could act as a short-term resistance. For STX to gain bullish momentum, it needs to break and hold above this level.
- The 99-period SMA, around $1.76, acts as a major barrier. Breaking this level is crucial for a sustained recovery.
These moving averages suggest that while the downtrend is still in play, a possible recovery could start if STX manages to break through the $1.68 and $1.76 resistance levels.
MACD: Bearish Momentum Easing
The MACD (Moving Average Convergence Divergence) indicator provides further insight into the price action.
- The MACD line is slightly above the signal line, with values of 0.002 for the MACD and -0.019 for the signal line. This indicates that the bearish momentum is losing steam, and we could see a potential bullish crossover soon.
- The MACD histogram is showing smaller bars, which signals that the downward momentum is weakening, though not yet fully reversed.
This suggests that while STX is still in a bearish phase, there’s a possibility for a short-term reversal if the MACD continues to show improvement.
Volume Analysis: A Crucial Missing Ingredient
Looking at the Volume SMA (9), we see that the volume is relatively low at 150.818K. Low volume often indicates that there is not enough buying interest to support a significant upward move. To break through the key resistance levels, STX will need a surge in volume, signaling that more buyers are entering the market.
In short, the lack of volume is a warning sign that the current price movements may not be strong enough to drive a meaningful recovery unless new interest picks up soon.
Market Sentiment and Recent News
Stacks, as a project, has been making waves in the crypto world due to its unique approach of bringing smart contracts and decentralized applications (dApps) to Bitcoin. While this long-term narrative is positive, the short-term price action has been largely influenced by broader market trends.
There hasn’t been any groundbreaking news recently that would serve as a catalyst for immediate price action. As such, STX’s price remains largely dependent on overall market conditions, which have been volatile due to macroeconomic factors and regulatory uncertainty.
Trading Strategies for STX: What Should You Do?
For Short-term Traders:
- Range Trading: The price has been fluctuating between $1.65 and $1.68. Traders could consider buying near the support of $1.65 and selling near the resistance at $1.68. Place a stop-loss below $1.60 to manage risk.
- Breakout Trading: If STX breaks above $1.68 with strong volume, it could signal a breakout, targeting the next resistance at $1.76. A break below $1.60 would open up shorting opportunities down to $1.55 or lower.
For Long-term Investors:
- Accumulate Strategy: If you’re bullish on Stacks’ long-term potential, this could be a good opportunity to accumulate more STX at lower levels. Consider buying near $1.65, with plans to add more if the price drops closer to $1.60.
- Hold Strategy: If you already hold STX, it may be wise to wait for a breakout above $1.76 before considering any further action. The project’s fundamentals remain strong, but the token needs to regain momentum before it becomes a strong buy again.
Conclusion: Will STX Rebound or Continue Sliding?
STX is currently in a precarious position. The $1.65 support is holding, but the token is facing resistance at $1.68 and $1.76. A breakout above these levels could signal the start of a recovery, but the low volume and bearish MACD indicators suggest that caution is still warranted.
Short-term traders should keep an eye on the $1.65 and $1.68 levels for range trading opportunities, while long-term investors may want to consider accumulating at these lower levels if they believe in the project’s future potential.
For more detailed insights and real-time analysis, follow my blog on Binance Square and join my Telegram channel to stay updated on market trends and strategies!

