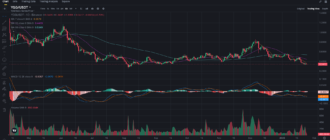
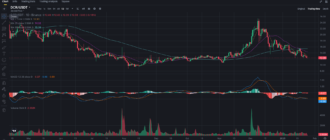
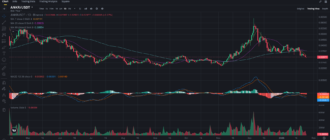
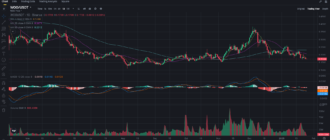
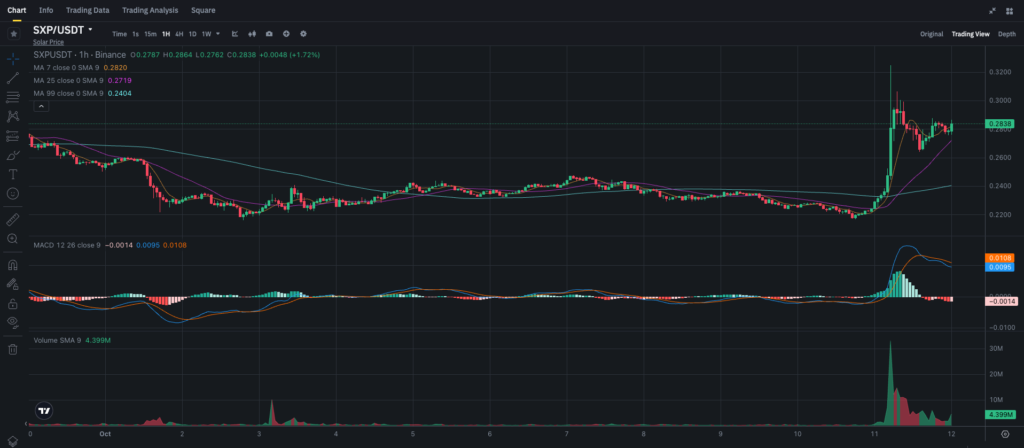
Solar (SXP) has recently caught the attention of traders with a significant price spike. Currently trading at 0.2838, the token has seen a strong upward surge, breaking through key resistance levels. The big question on everyone’s mind is: can this rally continue, or are we seeing a temporary spike before a correction?
Support and Resistance: Levels to Watch
Resistance Levels:
- $0.3000: This psychological barrier is the next major level to overcome. Solar briefly touched this level but has yet to close above it convincingly.
- $0.3200: Beyond $0.3000, the next resistance is at $0.3200. A break above this could open the doors for a more extended rally.
Support Levels:
- $0.2719: The 25-period Simple Moving Average (SMA) provides immediate support, making it a key level to watch if the price pulls back.
- $0.2404: The 99-period SMA serves as a long-term support level. If the price drops back to this range, it could present a buying opportunity for long-term traders.
Moving Averages: Strong Bullish Momentum
Solar has shown strong bullish momentum over the past few hours, as indicated by the following moving averages:
- The 7-period SMA at $0.2820 has acted as immediate support, showing that the short-term trend is still very much intact. As long as the price stays above this level, the bullish sentiment should remain.
- The 25-period SMA at $0.2719 provides medium-term support, suggesting that any dips could be temporary.
- The 99-period SMA at $0.2404 is a crucial long-term level. As Solar is trading above all three moving averages, it shows that the overall trend remains upward.
MACD: Bullish Crossover Confirmed
The MACD (Moving Average Convergence Divergence) indicator is another sign that bullish momentum is strong. With the MACD line at 0.0095 crossing above the signal line at 0.0108, a bullish crossover is confirmed. The MACD histogram has also been positive, indicating that upward momentum could continue.
Volume: Surge in Trading Volume
Volume is often a strong indicator of whether a price movement is sustainable, and Solar’s recent surge has been accompanied by high trading volume. The Volume SMA (9) is at 4.399M, showing significant interest in the token. This surge in volume suggests that the recent price spike isn’t just a temporary move but could be supported by strong demand.
Recent Developments and Market Sentiment
Solar’s recent rally could be attributed to several factors, such as:
- Market Sentiment: The broader crypto market has shown signs of recovery, and altcoins like Solar are benefiting from this positive sentiment.
- New Developments: Any news related to partnerships, upgrades, or use case developments could have contributed to Solar’s recent rise. While no major announcements have been made public, market speculation often drives price movements.
Trading and Investment Strategy
Short-term Traders:
- Look for a Breakout Above $0.3000: If Solar can break and hold above this psychological level, it could signal further upward movement. Short-term traders should consider entering long positions if a breakout occurs, with a target of $0.3200.
- Buy on Pullbacks: If the price pulls back to the $0.2719 support level, it could offer a good entry point. Setting a stop-loss below the 99-period SMA at $0.2404 will help manage risk.
Long-term Investors:
- Accumulate on Dips: For long-term holders, accumulating Solar on dips near the $0.2404 support level could provide an excellent risk-reward ratio.
- Hold for Future Gains: Given the rising interest in the token, long-term investors could benefit from holding as the overall trend remains bullish.
Conclusion: Is Solar Headed for More Gains?
Solar’s recent breakout above $0.3000 suggests that the token is in a strong uptrend. Key indicators like the MACD and moving averages all support the bullish case. However, traders should watch out for a possible pullback to the $0.2719 level, which could offer a buying opportunity.
For short-term traders, a clean break above $0.3000 could spark further gains, while long-term investors may find current levels attractive for gradual accumulation.
If you want to stay updated with more insights like this, follow my blog on Binance Square and join my Telegram channel for more timely analysis!


