Solana (SOL) has been one of the top-performing cryptocurrencies in the past year, and after a period of consolidation, it looks like things are starting to heat up again. With the recent price action showing a breakout to new local highs, SOL is getting the attention of both short-term traders and long-term investors. But what’s next for this high-performance Layer-1 blockchain? In this analysis, we’ll take a deep dive into the Solana chart and identify key price levels, technical signals, and potential trading strategies for investors.
Let’s break down the price action of SOL and provide some insights on where the price might be headed next.
Solana’s Recent Price Action: The Rise to $170
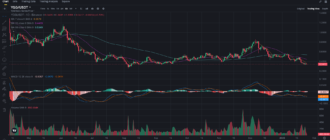
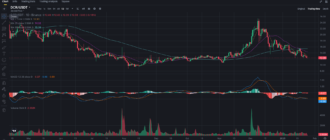
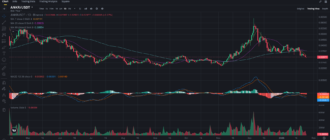
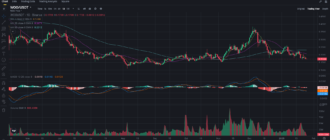
Looking at the 4-hour chart, Solana has seen a steady rise from its recent low of $120, breaking through resistance and currently sitting just below $170. The most recent rally was quite significant, with SOL surging past several important technical levels in a matter of days.
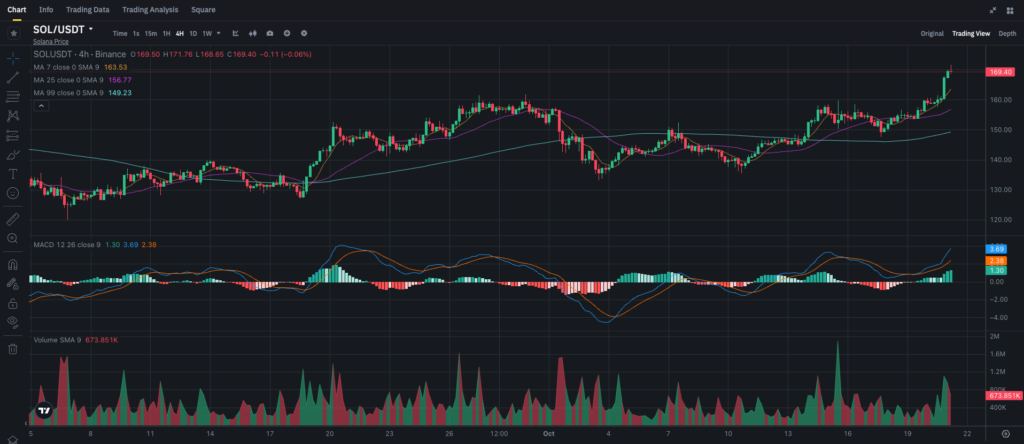
This upward trend has been supported by strong buying volume, with the 9-period Simple Moving Average (SMA) acting as a key support level during this rise. The 25-period SMA and 99-period SMA are trending upwards as well, reinforcing the current bullish structure of the chart.
Technical Indicators: Bullish Momentum Gaining Strength
Moving Averages: Bullish Crossover and Strong Support
The 7-period SMA is currently sitting at $163.53, acting as the closest support for the price. Meanwhile, the 25-period SMA at $156.77 and the 99-period SMA at $149.23 are trailing behind, showing that the short-term trend is significantly more bullish than the longer-term one.
These moving averages indicate strong momentum. The fact that the price is well above both the 25 and 99-period SMAs suggests that any pullbacks may be short-lived, as the broader trend remains intact.
MACD: Positive Cross and Building Momentum
The MACD indicator is showing a clear bullish signal, with the MACD line sitting well above the signal line at 3.69 and 2.38, respectively. The histogram has also turned green, showing increasing positive momentum.
This upward move in the MACD indicates that buying pressure is intensifying, and it aligns well with the recent price action. As long as the MACD remains in this bullish phase, there’s a strong chance SOL could continue to climb higher.
Volume: Surge in Buying Interest
Volume is a critical factor when analyzing price movements, and the volume SMA 9 at 673.851K shows strong participation in the recent rally. In general, higher volume during price increases is a good sign of healthy bullish momentum, and that’s exactly what we’re seeing here.
This volume spike confirms that the breakout above $160 is being supported by real buying interest, which reduces the risk of a false breakout.
Key Support and Resistance Levels
With the price of Solana currently sitting just below $170, there are several key levels that traders should be watching:
- Support at $163.50: This is the current level of the 7-period SMA and could act as the first level of support if the price pulls back.
- Secondary Support at $156.77: The 25-period SMA is the next level to watch for support. If SOL falls below this level, it could be a signal that the current uptrend is weakening.
- Resistance at $175: The next major resistance level is the psychological barrier of $175. A break above this level could see SOL target $185 or even $200 in the near future.
What’s Fueling the Solana Rally?
Solana has been gaining significant attention due to its high throughput and low transaction costs, making it a strong contender in the Layer-1 blockchain space. Recent news, including growing institutional interest and partnerships with various DeFi and NFT projects, has likely played a role in boosting investor sentiment.
Moreover, the broader crypto market has also seen a resurgence, which could be contributing to Solana’s price strength.
Trading Strategies for Solana
Short-Term Traders: Watch for a Break Above $170
For short-term traders, the key level to watch is $170. If SOL can break and hold above this resistance level, there’s a good chance it will push toward $175 and beyond. In this scenario, buying the breakout or entering a position on a retest of the $170 level could be a profitable strategy.
Traders should consider placing stop-loss orders just below the 7-period SMA at $163.50 to manage risk in case the breakout fails.
Long-Term Investors: Hold Through the Rally
For long-term holders, the recent price action is encouraging. Solana is maintaining its long-term bullish structure, and the recent breakout is a sign that the uptrend is still intact. Long-term investors may want to continue holding their positions and consider buying additional SOL on any dips back toward the 25-period SMA at $156.77 or the 99-period SMA at $149.23.
If Solana manages to break through the $175 level convincingly, it could signal the start of a much larger rally, potentially targeting $200 in the coming weeks.
Price Prediction: Where Could Solana Go Next?
Based on the technical analysis, Solana looks poised for more upside in the near future. The combination of bullish moving averages, a strong MACD signal, and rising volume all point to a continuation of the uptrend.
Best-Case Scenario:
- If Solana can break above $170 and hold, the next target would be $175, followed by $185. If the broader market remains bullish, it’s possible we could see a push toward $200 in the coming weeks.
Worst-Case Scenario:
- If Solana fails to hold above the 7-period SMA at $163.50, it could see a pullback toward $156.77 or even $149.23. However, these levels would likely serve as strong support, and any dips to these areas could be buying opportunities for long-term investors.
Conclusion: Solana’s Bullish Momentum is Building
Solana is currently in a strong uptrend, and the recent price action suggests that more gains could be on the horizon. For short-term traders, the focus should be on the $170 resistance level, while long-term investors may want to hold their positions and look for buying opportunities on dips.
The combination of bullish technical indicators and strong volume support the idea that Solana could continue to climb higher in the coming weeks, with $175 and $185 being the next major targets.
To stay updated on Solana and other top-performing cryptocurrencies, be sure to follow my blog on Binance Square and join my Telegram channel for the latest market analysis.


