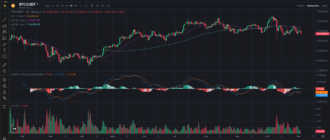
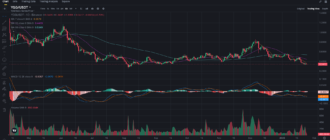
Solana (SOL) has been one of the most exciting projects in the crypto space, known for its high-speed network and strong ecosystem growth. Recently, its price has shown mixed signals, consolidating around the $140 mark after dropping from highs in mid-September. Let’s analyze the charts and see what Solana’s future might look like from a technical perspective.
SOL Price Overview: Recovery or Rejection?
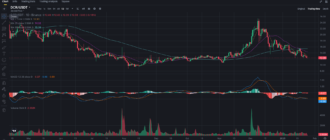
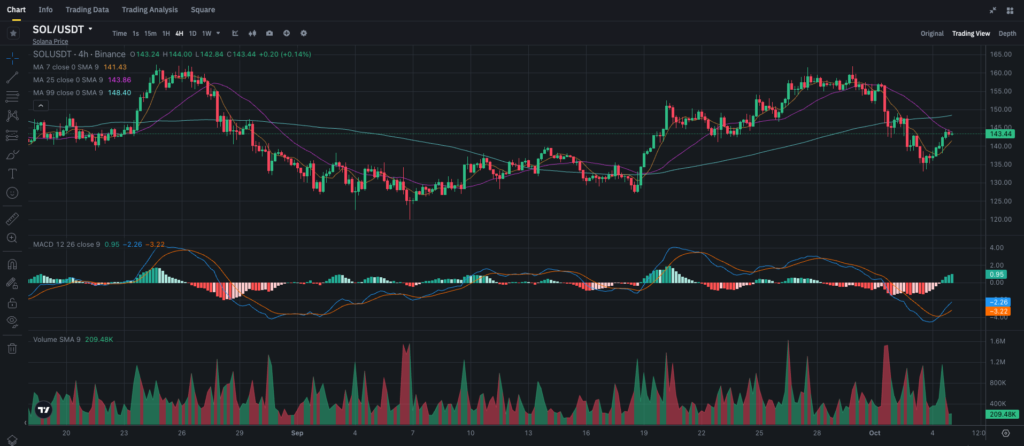
Looking at the 4-hour chart, we can see that Solana had been trading in a strong uptrend in late August, reaching a high of $166. However, since then, the market has corrected, and the price has been oscillating between $135 and $145. As of October 5th, SOL is trading at around $143, showing signs of potential consolidation or a reversal.
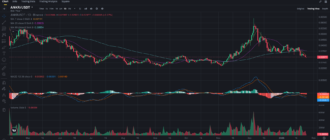
The 1-hour chart gives us a more detailed view of recent price action. Solana has been attempting to recover from a drop to $135 but is struggling to break above the $145 level. This makes $145 a crucial resistance zone for SOL.
Key Technical Indicators
Moving Averages
- On the 4-hour chart, the 7-period SMA (simple moving average) is at $141.43, acting as immediate support. The 25-period SMA is at $143.86, and the 99-period SMA is slightly higher at $148.40. This alignment of moving averages suggests that the price is currently in a sideways consolidation phase, but with resistance ahead.
- On the 1-hour chart, the 7-period SMA is at $143.49, just above the current price, indicating that the market needs a push to break this short-term resistance. The 25-period SMA at $141.36 serves as the immediate support.
MACD (Moving Average Convergence Divergence)
The MACD indicator on the 4-hour chart is showing signs of a potential bullish momentum building. The MACD line has crossed above the signal line, with the histogram turning positive, suggesting that buyers are starting to step back in. However, the magnitude of the momentum is still moderate, and Solana will need stronger volume to see a significant price rally.
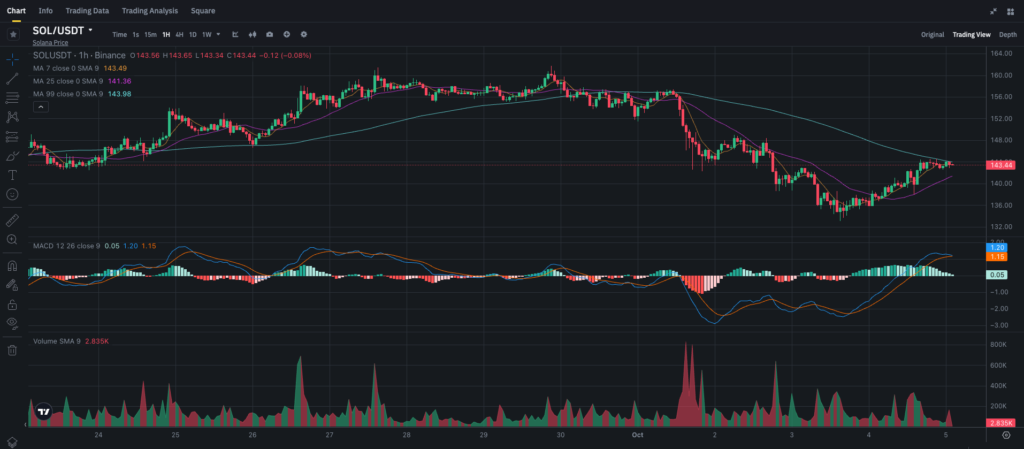
On the 1-hour chart, the MACD is already bullish, with a steady rise in the histogram bars. This could be an early signal that Solana is ready to test the $145 resistance level again.
Volume Analysis
One concern is the decreasing volume on both timeframes. While the MACD shows some bullish potential, the lack of significant trading volume could limit Solana’s ability to break higher. On the 4-hour chart, volume has been declining steadily since mid-September, indicating reduced interest from buyers. The 1-hour chart also reflects lower volume spikes, showing that while short-term traders are active, long-term investors may be waiting on the sidelines for confirmation.
Support and Resistance Levels
- Support Levels: Immediate support is found at $141.43 (7-period SMA on the 4-hour chart), with stronger support at $135.
- Resistance Levels: Key resistance is at $145, which aligns with the 25-period SMA on both charts. Breaking this level could see Solana head towards $150, with a stronger resistance level at $148.
Short-Term and Long-Term Outlook
Bullish Scenario
If Solana can break above $145 convincingly, the next target would be $150. A breach of this psychological barrier would likely see the price push toward $155, and potentially retest its September high of $166. For short-term traders, entering on a breakout above $145 could provide an opportunity to ride the bullish momentum, with a stop-loss set just below $140.
Bearish Scenario
On the other hand, if Solana fails to break above $145, it could fall back towards its support at $141, and if that breaks, $135 becomes the next critical level. If the price falls below $135, it could signal a broader downtrend, opening the possibility for a retest of $130 or even lower levels.
Short-term traders could consider shorting if Solana fails to break above $145, targeting $135 with a tight stop-loss above $145.
Consolidation Scenario
The current price movement suggests that Solana might continue to consolidate between $140 and $145 for a while. This sideways movement could give the market time to gather momentum before making a significant move. Scalping opportunities could be found within this range, but for more decisive price action, traders should watch for a breakout either above $145 or below $135.
Final Recommendations
For Short-Term Traders
- Bullish Entry: Look for a breakout above $145, with a target of $150-$155.
- Bearish Entry: If the price fails to break $145, consider shorting with a target of $135.
- Consolidation Play: Watch for scalping opportunities between $140 and $145 if Solana continues its sideways movement.
For Long-Term Investors
- Buying Solana around the current price of $143 could be a good entry point if you’re bullish on the long-term fundamentals of the project. However, it’s worth noting that a dip to $135 could present an even better buying opportunity if the market remains in a broader consolidation phase.
Conclusion
Solana is currently at a key crossroads, with its price poised between critical support and resistance levels. Whether SOL pushes higher or retraces will largely depend on whether buyers can generate enough volume to break through the $145 resistance. As always, keeping a close eye on the charts and reacting to market movements is crucial in such volatile conditions.
If you’re looking for more in-depth analysis on Solana and other crypto assets, don’t forget to subscribe to my blog on Binance Square here. Stay ahead of the market and get real-time updates!

