In the fast-moving world of crypto, tokens like SAGA are catching the attention of traders and investors alike. Over the past few days, SAGA has experienced a significant price jump, making it one of the more exciting coins to watch. With the recent breakout above crucial resistance levels, it’s time to take a closer look at what the chart tells us and what we can expect in the short and long term.
Why Is SAGA Surging?
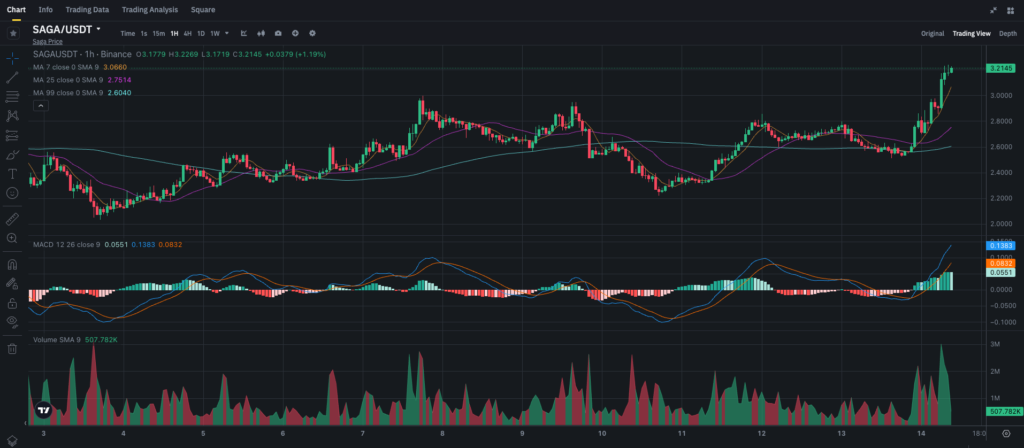
SAGA’s price has risen sharply, currently sitting at 3.21. Several factors could be influencing this spike, including overall market sentiment, technical breakouts, or renewed interest in the project. SAGA may also be benefitting from increased volume and media coverage. However, while the price action is undeniably bullish, it’s essential to determine whether this rally has more room to run or if a correction is imminent.
Technical Analysis of SAGA
Support and Resistance Levels
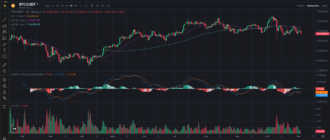
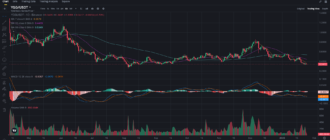
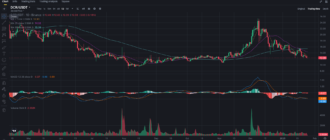
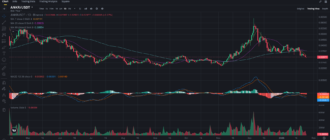
- Immediate Resistance at 3.25: SAGA is currently approaching a key resistance level at 3.25. A breakout above this level could pave the way for further gains, with the next target potentially around 3.50.
- Support at 2.75: If SAGA faces rejection at 3.25, it may retrace to its immediate support at 2.75, where the 7-period SMA sits. This level has been tested multiple times in the past and may serve as a buffer if the price falls.
- Major Support at 2.60: In case of a broader market pullback, 2.60 is a critical support zone as indicated by the 99-period SMA. A dip to this level could signal a buying opportunity for long-term investors looking for a lower entry.
Moving Averages: The Bullish Cross
The 7-period SMA at 3.06 is moving well above the 25-period SMA at 2.75, confirming the short-term bullish trend. The longer-term 99-period SMA at 2.60 shows the overall upward momentum that SAGA has built over the past few days. This alignment of moving averages suggests that buyers are firmly in control, and unless we see a drastic shift in market sentiment, the uptrend could continue.
MACD: Momentum Still Strong
The MACD indicator confirms the bullish momentum, with the MACD line at 0.1383 well above the signal line at 0.0832. This positive divergence indicates strong buying pressure, and the histogram continues to expand. However, traders should remain cautious as any signs of MACD convergence could indicate a slowdown or potential reversal in the short term.
Volume: Elevated Levels Support the Trend
Volume plays a crucial role in validating price movements, and SAGA has seen sustained volume spikes during this latest rally. The Volume SMA (9) is currently at 507.782K, with significant bursts of activity indicating high levels of market participation. As long as volume remains elevated, there is a higher likelihood that the price will continue to rise. However, any sudden drop in volume could signal fading buying interest.
Trading Strategies for SAGA
For Short-Term Traders:
- Look for a Breakout Above 3.25: If SAGA breaks and holds above 3.25, short-term traders can target gains toward 3.50 or even higher. Setting a tight stop-loss around 3.10 could help mitigate risk in case of a failed breakout.
- Buy on Dips Around 2.75: For those waiting for a lower entry, a pullback to the support level of 2.75 offers a potential buying opportunity. With the 7-period SMA acting as support, traders could aim to ride the next leg up from this level.
For Long-Term Investors:
- Accumulate on Dips: Long-term investors may consider accumulating SAGA on pullbacks to 2.75 or 2.60, where support is strong. These levels offer favorable entry points for those looking to hold through potential volatility.
- Hold for Higher Targets: Given the bullish trend and strong technical signals, long-term holders could benefit from maintaining their positions as SAGA aims for 3.50 and beyond. If market conditions remain favorable, SAGA has the potential to test new highs.
Price Prediction for SAGA
Considering the current momentum and bullish indicators, SAGA is likely to continue its upward trend in the near term. If the price breaks through the 3.25 resistance, the next major target would be 3.50, with an extension toward 3.75 if bullish sentiment remains strong.
On the downside, if SAGA fails to maintain momentum and breaks below 2.75, it could see a more significant correction toward 2.60, where major support lies. In this case, long-term investors may find it a prime opportunity to buy at a lower price.
Conclusion: What’s Next for SAGA?
SAGA’s price action over the last few days has been impressive, and the bullish trend looks set to continue. With strong support levels at 2.75 and 2.60, traders can watch these levels for potential buying opportunities if the market retraces. On the upside, a breakout above 3.25 could lead to further gains, making SAGA a token to watch closely.
Whether you’re a short-term trader or a long-term investor, SAGA offers intriguing opportunities. As always, it’s important to monitor key technical levels and manage risk appropriately.
To stay updated on the latest market insights and analysis, follow my blog on Binance Square and join my Telegram channel for more in-depth crypto discussions.

