Render Token (RNDR) has been on many traders’ radars recently due to its unique value proposition within the decentralized GPU rendering space. After a period of decline, the price of RNDR is showing early signs of recovery, and traders are wondering whether this is a solid entry point or just a brief respite before another leg down. Let’s break down the chart, analyze key indicators, and outline possible strategies for both short-term traders and long-term investors.
Key Levels: Support and Resistance
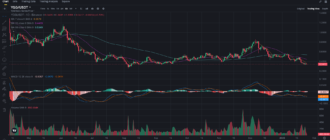
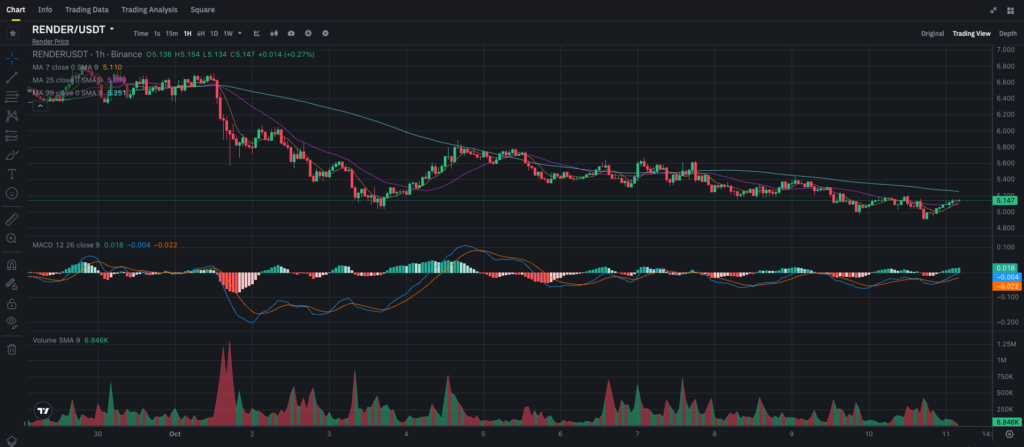
At the time of writing, RNDR is trading around $5.14, slightly above recent lows. The price action is approaching some critical levels, and understanding these is crucial for both buyers and sellers.
Support Levels:
- $5.00: This psychological level has provided support over the past few days. If RNDR breaks below $5.00, it could signal further downside, potentially toward $4.80.
- $4.80: This is the stronger support level, where buyers stepped in during the last significant correction. If RNDR retraces to this level, it could present a solid buying opportunity.
Resistance Levels:
- $5.25: RNDR is currently struggling to break through this resistance level, which is aligned with the 99-period SMA. A successful break above this level could open the door for a more significant move upwards.
- $5.50: The next resistance is around $5.50, and breaking through this could lead to further gains toward $5.80, which is where the price previously found resistance.
Moving Averages: A Turning Point?
Moving averages can provide valuable insight into potential trend reversals, and the chart is starting to show early signs of a bullish shift:
- The 7-period SMA is currently at $5.11, just below the current price. This signals short-term bullish momentum. If RNDR can stay above this level, it could be a confirmation of the short-term trend reversal.
- The 25-period SMA sits at $5.10. RNDR has broken above this level, which is another positive sign. The challenge now lies in breaking the 99-period SMA, currently at $5.25.
- A break above the 99-period SMA would indicate the beginning of a larger reversal, and the bulls may take control from there.
MACD: Bullish Divergence Signals Potential Upside
The MACD (Moving Average Convergence Divergence) is showing some promising signs for RNDR:
- The MACD line has crossed above the signal line and is currently in positive territory, with the MACD at 0.018. This suggests that bullish momentum is building.
- The MACD histogram has also flipped to positive, reinforcing the idea that buyers are gaining strength and a short-term upward move could be imminent.
However, it’s important to note that while the MACD is flashing bullish signals, it’s still relatively weak. This means that while there is upside potential, caution should be exercised until RNDR breaks key resistance levels.
Volume: A Moderate Increase in Interest
Volume is another critical factor when assessing potential price moves. The Volume SMA (9) is at 6.846K, which represents a moderate level of activity. Although the volume isn’t surging yet, it is holding steady. Increased volume in the coming days could confirm a potential breakout, so traders should keep a close eye on any spikes in buying activity.
Recent Developments Driving RNDR’s Price
Several fundamental factors could influence RNDR’s price action over the short and long term:
- Decentralized Rendering Demand: As more creative professionals look to decentralized rendering solutions, RNDR could see increased usage. Any significant partnerships or integrations with popular platforms in the metaverse or NFT space could drive investor interest.
- Market Conditions: Like many altcoins, RNDR’s price is impacted by overall market sentiment. If the broader crypto market, particularly Bitcoin and Ethereum, continues its recovery, RNDR is likely to benefit from the positive sentiment.
- Technology Updates: Any updates from the Render Network on their platform development, new features, or community growth could spark renewed investor interest, driving the price higher.
Trading and Investment Recommendations
For Short-term Traders:
- Range Trading: RNDR is currently trading in a tight range between $5.00 and $5.25. Short-term traders can look to buy near support around $5.00 and sell near resistance at $5.25 for quick profits. Consider setting a stop-loss just below $4.90 to manage risk.
- Breakout Strategy: If RNDR breaks above the $5.25 level, it could trigger a rally toward the next resistance at $5.50 and even further toward $5.80. Traders should watch for confirmation from increased volume before entering long positions.
For Long-term Investors:
- Accumulate on Dips: Long-term investors could consider accumulating RNDR around the $5.00 mark. With its strong fundamentals and growing use case, RNDR could see significant price appreciation over the long term.
- Hodl Strategy: If you’re already holding RNDR, patience might pay off. With the project’s continued growth and increasing adoption, RNDR could see a steady rise in value as the demand for decentralized GPU rendering increases.
Conclusion: RNDR Nearing a Breakout?
RNDR is showing promising signs of a short-term reversal. With key support levels holding and technical indicators such as the MACD pointing to increasing bullish momentum, RNDR could soon challenge the $5.25 resistance. However, traders should wait for confirmation of a breakout before taking significant positions.
For now, both short-term traders and long-term investors have options. Traders can play the current range, while long-term investors can accumulate during dips, with an eye on the potential for future gains.
Interested in more detailed crypto analysis? Follow my blog on Binance Square for in-depth market insights, and join my Telegram channel for exclusive trading tips and discussions.

