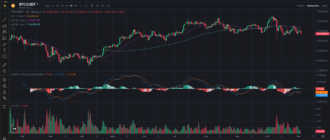
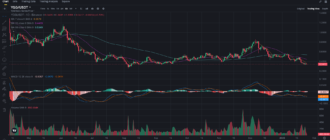
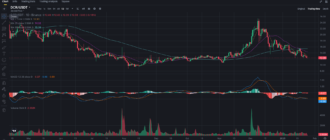
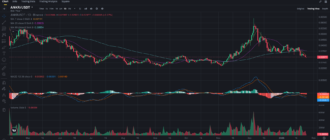
Raydium (RAY) has been on a steady upward climb, demonstrating bullish momentum in recent weeks. The current price action suggests that RAY is gearing up for a potential breakout, as it continues to test higher resistance levels. With strong technical indicators and solid support levels, the market seems poised to make its next move. Let’s analyze the charts and see where RAY might be heading.
Recent Price Action Overview
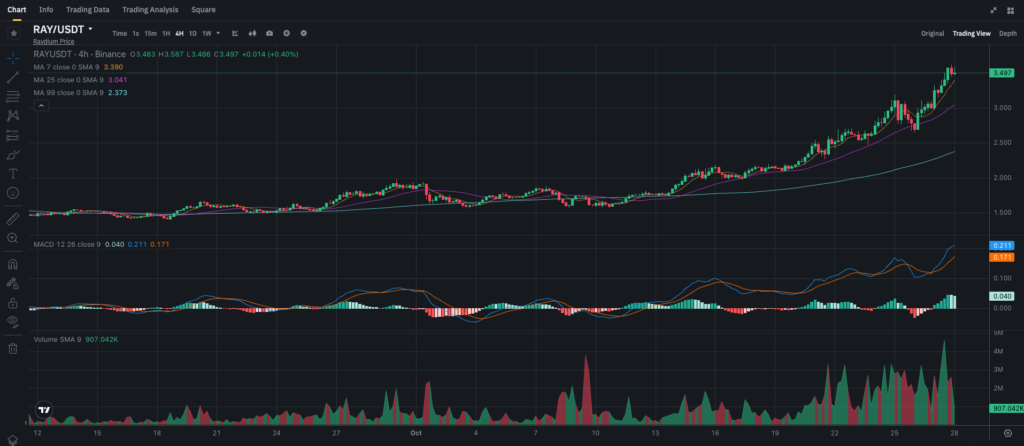
Over the past few weeks, RAY has shown a consistent uptrend, pushing past several resistance levels and currently trading at $3.497. This marks a substantial rally from its earlier support level near $2.00. The current bullish structure on the chart suggests that RAY may be building momentum for a potential push to higher levels, with minimal pullbacks so far.
Technical Indicator Analysis
Simple Moving Averages (SMA)
• 7-Period SMA: The 7-SMA is currently positioned at $3.39, acting as immediate support. RAY is trading above this level, showing short-term bullish momentum. If the price continues to respect this support, it may suggest that buyers are confident in pushing the price higher.
• 25-Period SMA: The 25-SMA sits at $3.041, providing additional support. This SMA has been crucial in maintaining the uptrend, as RAY has bounced off this level multiple times during minor retracements. Traders will likely monitor this level closely to gauge whether the bullish trend can be sustained.
• 99-Period SMA: The 99-SMA is located at $2.373 and serves as the long-term support level, indicating a strong bullish trend for RAY. Even if short-term corrections occur, the 99-SMA provides a solid base for the price to recover.
MACD (Moving Average Convergence Divergence)
The MACD indicator shows strong bullish momentum, with the MACD line (0.211) well above the signal line (0.171). The histogram displays consistent green bars, indicating that buying pressure remains dominant. This suggests that the bullish momentum is still intact and could propel RAY higher if volume continues to increase. However, any reduction in MACD strength should be closely monitored for signs of potential trend reversal.
Volume Analysis
Trading volume has shown steady increases, particularly during price spikes when RAY reached new highs. Recent volume bars confirm that there is sufficient buyer interest to maintain the uptrend. For RAY to break above the $3.50 resistance level convincingly, it will need to see a spike in volume. A lack of volume during a price rise might indicate weakness and could result in a pullback.
Key Support and Resistance Levels
• Support Levels:
• The first immediate support level is at $3.39, aligned with the 7-SMA. This level has held firm, allowing RAY to maintain its bullish trajectory.
• The 25-SMA at $3.041 is the next major support, which has acted as a reliable floor during minor retracements. A breach below this level could see the price testing $2.50 or lower.
• Long-term support is found at $2.373, in line with the 99-SMA, providing a strong safety net should the price experience a significant dip.
• Resistance Levels:
• The immediate resistance level is at $3.50. A successful breakout above this level with increased volume could open the door to testing higher targets, such as $3.80 or even $4.00.
• Further up, if momentum continues, the next key level to watch would be around $4.50, which represents a psychological and technical resistance area for traders.
Market Sentiment and Broader Trends
Raydium’s price action aligns with broader market sentiment, reflecting optimism in the DeFi sector and the Solana ecosystem, of which Raydium is a major part. The recent bullish trend could be attributed to growing interest in decentralized exchanges (DEXs) and liquidity provision solutions, making RAY a key player within its niche.
However, the market remains volatile, and any negative sentiment affecting Solana or DeFi projects as a whole could impact RAY’s price performance. It’s important for traders to stay updated on broader market trends and developments that might influence investor sentiment toward Raydium.
Trading and Investment Strategies
For Short-Term Traders
Short-term traders should keep an eye on the $3.50 resistance level. If RAY breaks above this level with strong volume, it could present an opportunity for a long position, targeting $3.80 or higher. However, if it struggles to break through and volume remains low, a retracement to $3.041 or even $2.90 could be in play. It is advisable to set stop-loss orders below the $3.041 level to minimize risk in case of a downturn.
For Long-Term Investors
Long-term investors might consider accumulating RAY on pullbacks, especially if the price revisits the $3.041 or $2.373 support levels. The current trend and the long-term uptrend signal that RAY remains in a favorable position for potential growth. Investors who believe in Raydium’s role in the expanding DeFi space and Solana ecosystem may find these levels to be strategic entry points.
Price Prediction
If RAY successfully breaks above the $3.50 resistance, we could see a move toward the $3.80 or even $4.00 range. Sustained bullish momentum and increased volume will be key to achieving these targets. Conversely, failure to break above $3.50 could lead to a retracement toward the $3.041 support level, where the next move will be determined by volume and broader market conditions.
Conclusion
RAY is currently testing critical resistance levels that will determine its next direction. Short-term traders should watch for a breakout above $3.50 with volume confirmation, while long-term investors may consider accumulating at key support levels. As always, maintaining proper risk management and monitoring market developments are crucial for successfully navigating RAY’s price movements.
For more in-depth market analysis and daily updates, be sure to follow my blog on Binance Square here. To stay updated on the latest trade insights, join my Telegram channel here.

