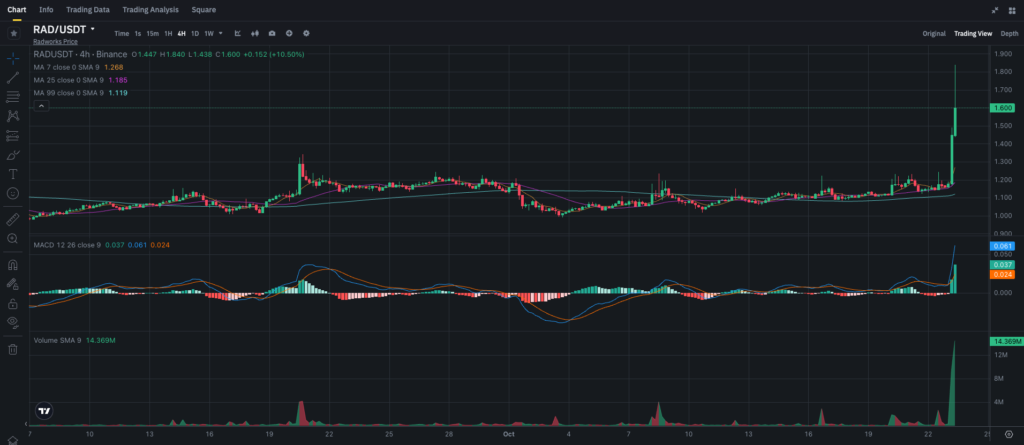
Radworks (RAD) has taken the market by storm with an explosive breakout, leaving many traders wondering if this rally has more room to run. The price has surged over 10% in a single session, with RAD now trading around $1.60. If you’re holding RAD or thinking about jumping in, now is the time to pay close attention to the chart signals and potential strategies to capitalize on this price action.
In this article, we’ll break down RAD’s recent movements, provide a forecast for what could come next, and offer strategies for both short-term traders and long-term investors.
RAD’s Breakout: What’s Driving the Surge?
As RAD’s price action becomes the center of attention, it’s essential to consider a few possible factors behind this surge:
• Positive Market Sentiment: Over the past week, many altcoins have seen significant price increases, with Radworks following suit. This rally could be part of a broader movement of positive sentiment in the altcoin market.
• High Volume Breakout: A quick look at the chart shows a massive increase in trading volume, supporting the price jump. High volume during a price spike typically indicates that the move is supported by strong buying activity, which makes the breakout more likely to continue.
• Potential News or Development: Although no specific major news related to Radworks has surfaced recently, market speculation and rumors often drive these sudden price movements.
Technical Analysis: RAD’s Bullish Indicators
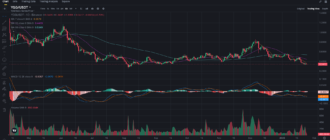
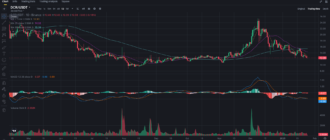
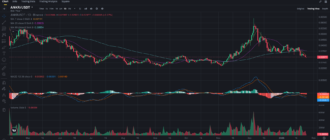
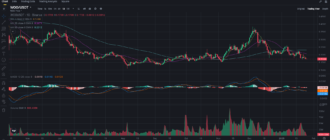
Let’s dive deeper into the 4-hour chart and explore the technical indicators driving RAD’s breakout.
Moving Averages: A Clear Uptrend
The moving averages are showing clear bullish signals:
• 7-period SMA: This short-term moving average has sharply risen to $1.268, signaling strong momentum in RAD’s current uptrend.
• 25-period SMA: The mid-term average sits at $1.185, indicating support just below the current price.
• 99-period SMA: At $1.119, this longer-term average is far below the current price, confirming that the trend has decisively shifted to the upside.
MACD: Momentum Backing the Breakout
The MACD (Moving Average Convergence Divergence) indicator is showing a very bullish signal. The MACD line has crossed above the signal line, with a reading of 0.061, and the histogram is widening, indicating growing momentum. A MACD crossover like this, especially during a sharp breakout, typically suggests that the price will continue to rise.
Volume Surge: Confirming the Breakout
Trading volume has surged significantly, reaching over 14.36M. This high volume during the breakout indicates that the move is backed by strong buying interest. When a breakout is accompanied by such a volume spike, it usually suggests that the rally is not a fluke and could see continuation.
Key Support and Resistance Levels
Support Levels:
• $1.50: This is the most immediate support level, where the price may retrace after the sharp move upward. If RAD pulls back and holds above $1.50, it will likely continue its upward movement.
• $1.30: This was a previous resistance level and could now serve as strong support in case of a larger correction.
Resistance Levels:
• $1.75: This is the next resistance level to watch closely. If RAD manages to break above this level, it could signal a move toward $2.00.
• $2.00: A psychological resistance level, which could trigger a fresh round of buying if breached.
Trading Strategy: What’s Next for Traders?
Short-Term Traders: Play the Breakout or Wait for a Pullback?
For short-term traders, RAD presents an attractive opportunity, but you need to be strategic:
• Bullish Strategy: If RAD breaks above $1.75, consider opening a long position, with a target of $2.00. However, place your stop-loss slightly below $1.50 to protect yourself in case of a reversal.
• Cautious Strategy: Alternatively, wait for a pullback to $1.50 or $1.30 and look for signs of support before entering a position. If the price consolidates above these levels, it could be a good opportunity to ride the next leg up.
Long-Term Investors: Accumulate or Wait?
For long-term holders, RAD’s strong breakout suggests potential further gains, but it’s always wise to be cautious after such sharp moves.
• Accumulation Strategy: If you believe in RAD’s long-term potential, consider buying dips around the $1.50 support level. Accumulating during corrections will give you a better entry point if the trend continues higher.
• Wait-and-See Approach: If you’re more risk-averse, waiting for the price to stabilize around $1.75 or even $2.00 could provide a more reliable confirmation that the uptrend is sustainable.
Price Prediction: How Far Can RAD Go?
Now that RAD has broken out, where could the price go next? Based on the current chart patterns and technical signals, we can explore two possible scenarios:
Bullish Scenario:
• If RAD breaks through the $1.75 resistance level, it could easily rally toward $2.00. Given the strength of the volume backing the breakout, reaching $2.50 within the next few days isn’t out of the question if buyers continue to flood in.
Bearish Scenario:
• On the other hand, if RAD fails to hold above $1.50, it could retest the $1.30 support. A break below this level would likely lead to a deeper correction, possibly toward $1.20 or $1.10.
Final Thoughts: RAD’s Explosive Move
Radworks (RAD) is making headlines with its explosive price movement. Whether you’re a short-term trader or a long-term investor, this is a pivotal moment for RAD, and paying attention to the key support and resistance levels will be crucial. The surge in volume and bullish indicators suggest that RAD has more upside potential, but as always, managing risk is essential.
Don’t miss out on more real-time analysis of RAD and other promising cryptocurrencies—subscribe to my blog on Binance Square to stay updated, and follow my Telegram channel for live insights and strategies.


