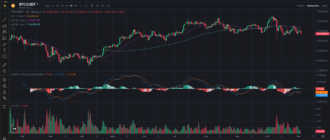
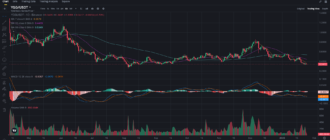
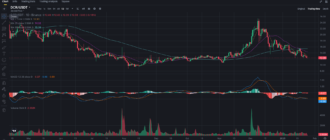
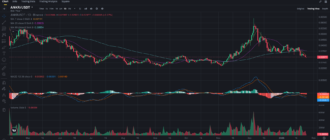
Radworks (RAD) has recently shown a mix of promising price action and pullbacks, putting it at a crossroads where the market could either push higher or consolidate further. As traders watch closely, key levels of support and resistance are defining the outlook for RAD in the short term. Let’s dive into the technical indicators and chart patterns to understand where RAD might be heading next.
Recent Price Movement Overview
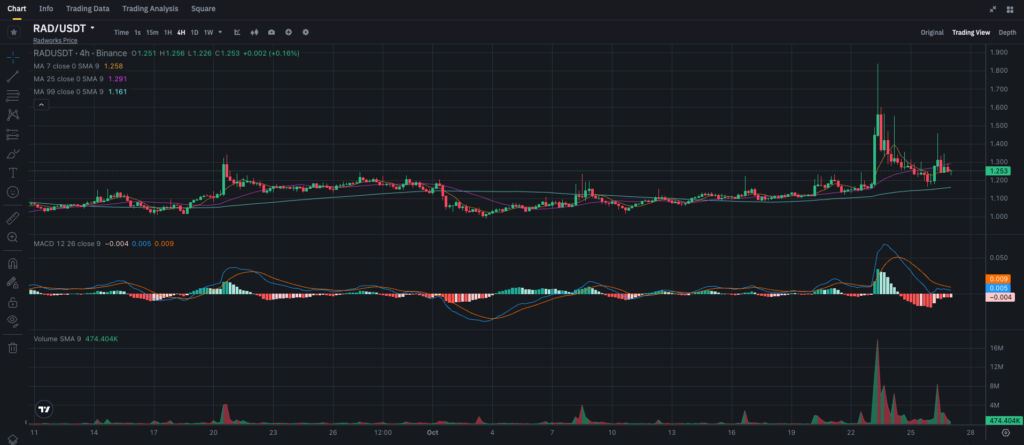
RAD has been trading in a relatively tight range between $1.20 and $1.40 over the past few weeks. The recent peak reached around $1.80, but the price was unable to sustain this level and pulled back to find support at the $1.20 region. Currently, RAD trades at $1.253, showing a slight uptick in momentum as it tests short-term resistance levels.
Technical Indicator Analysis
Simple Moving Averages (SMA)
• 7-Period SMA: The 7-SMA is positioned at $1.258, almost in line with the current price. This suggests that RAD is hovering around its short-term trend. If the price can hold above this level, it could indicate a developing bullish momentum. However, if RAD dips below this moving average, it may suggest further consolidation or a short-term pullback.
• 25-Period SMA: The 25-SMA is situated at $1.291, acting as a resistance level. For a more bullish outlook, RAD must break and close above this moving average with substantial volume, which would support further upward movement.
• 99-Period SMA: The long-term 99-SMA is currently at $1.161, offering a key support level. This indicates that, despite recent volatility, RAD remains in a longer-term uptrend. This SMA acts as a safety net, and any major dip close to this level could be an opportunity for long-term investors to accumulate.
MACD (Moving Average Convergence Divergence)
The MACD shows mixed signals. While the MACD line has crossed above the signal line recently, the histogram bars remain small, suggesting that bullish momentum is still tentative. If the MACD line continues rising and green histogram bars increase in size, it could confirm a stronger bullish phase. Conversely, a dip below the signal line could signal further consolidation or a potential reversal.
Volume Analysis
The trading volume has shown spikes, particularly during the last price surge toward $1.80. This spike indicates strong buying interest when RAD nears higher resistance levels. However, recent volume has tapered off, suggesting that traders are hesitant to push the price higher without additional bullish signals. A sustained increase in volume will be critical for any breakout attempt above the $1.291 resistance.
Key Support and Resistance Levels
• Support Levels:
• Immediate support is at $1.20, coinciding with the bottom of the recent price range. This level has been tested multiple times and has held, indicating strong buyer interest at this price point.
• The next major support lies at $1.161, aligned with the 99-SMA. This is a crucial level for long-term trend continuation. A break below this support could suggest a shift in sentiment toward a bearish outlook.
• Resistance Levels:
• The first key resistance is at $1.291, as marked by the 25-SMA. A successful break above this level could see RAD challenging the recent high of $1.80 again.
• Further up, $1.40 is another resistance level traders should watch. A breakout above this could indicate a return to a bullish phase, with the potential to test $1.80 and beyond.
Market Sentiment and Broader Trends
Radworks has been following the broader market sentiment, showing volatility typical of many altcoins as they navigate between consolidation phases and breakouts. The overall market environment remains cautious, and RAD’s price action reflects this hesitancy. Should positive developments emerge in the cryptocurrency market or if there is increased attention toward Radworks’ platform, it could provide the necessary catalyst for RAD to push higher. Conversely, any negative sentiment or downturn in the broader market could quickly send RAD back to support levels.
Trading and Investment Strategies
For Short-Term Traders
Short-term traders should focus on the $1.291 resistance level. A confirmed breakout above this level, supported by rising volume, could present an opportunity to enter a long position targeting $1.40 or even $1.80. It’s essential to use stop-loss orders below the $1.20 support level to manage risk in case of a downside move. Monitoring the MACD and volume closely will be crucial in determining if the breakout attempt is genuine or likely to fail.
For Long-Term Investors
Long-term investors could consider accumulating RAD if the price revisits the $1.20 or $1.161 support levels. These levels offer a safer entry point given their historical significance as support. The overall uptrend indicated by the 99-SMA suggests that RAD still holds long-term potential. Investors who believe in the future development of Radworks’ platform might see these dips as strategic buying opportunities, using a dollar-cost averaging (DCA) approach to minimize risk.
Price Prediction
If RAD successfully breaks above the $1.291 resistance, we could see a retest of the $1.40 level, with the potential to push toward $1.80. However, if it fails to break above this resistance and volume remains low, a retracement back to $1.20 or even $1.161 could occur. Traders and investors should keep an eye on volume as a key indicator for the next significant price movement.
Conclusion
RAD is at a critical juncture, testing resistance around the $1.291 level. The upcoming price action will determine whether it can sustain a rally or consolidate further. Short-term traders should wait for confirmation of a breakout with increased volume before entering new positions, while long-term investors may find accumulating on dips near key support levels to be a strategic approach. As always, proper risk management and attention to market developments are essential for navigating RAD’s price movements.
For more in-depth market analysis and daily trade insights, don’t forget to follow my blog on Binance Square here. For the latest updates, join my Telegram channel here.

