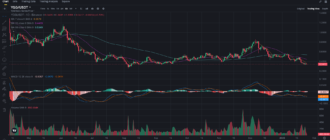
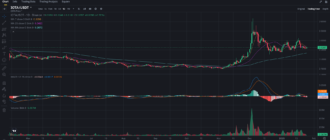
Polygon’s ecosystem token POL has been through a rough patch lately, with the token facing continuous downward pressure. After hitting highs near 0.44, the token has struggled to maintain its momentum, leading to a bearish slide. Currently trading around 0.3696, the market is watching closely to see if POL can break out of its downtrend and stage a recovery. Let’s dive into the technical analysis and explore potential strategies for traders and investors.
POL’s Key Support and Resistance Levels
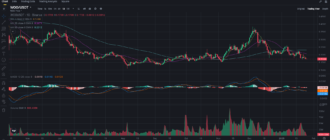
The recent downtrend has brought POL to critical levels of support, while resistance levels are looming overhead. Understanding these levels will help traders navigate the potential price movement in the coming days.
Support Levels:
- 0.3600: This is a key support level that POL needs to hold. A break below this level could lead to further selling pressure and a test of lower levels around 0.3500.
- 0.3500: A psychological support level that could come into play if POL fails to hold 0.3600. A break below this level could lead to a more significant decline.
Resistance Levels:
- 0.3727: The first significant resistance, as indicated by the 25-period moving average. POL needs to break above this to show any signs of recovery.
- 0.3800: If POL manages to break 0.3727, the next challenge will be the 99-period moving average at 0.3782. Clearing this level could trigger a bullish momentum toward 0.4000.
Moving Averages: Mixed Signals
Moving averages give a clearer picture of the trend, and right now, they are suggesting that POL is still under bearish pressure:
- The 7-period SMA is at 0.3672, slightly below the current price. This means POL is trying to stay above short-term moving averages, which could indicate a possible attempt to break out of the downtrend.
- The 25-period SMA at 0.3727 is acting as short-term resistance, highlighting that POL is facing difficulty moving higher.
- The 99-period SMA is at 0.3782, far above the current price, showing that POL is still in a longer-term downtrend.
These indicators suggest that POL needs to reclaim its position above the 25-period and 99-period moving averages to initiate any meaningful recovery.
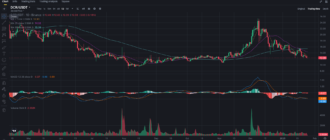
MACD: Bearish Momentum Weakening

The MACD (Moving Average Convergence Divergence) indicator is beginning to show signs of weakening bearish momentum:
- The MACD line is hovering close to the signal line, with the MACD at -0.0023 and the signal line at -0.0023. While these values indicate that POL is still in bearish territory, the convergence of the two lines suggests that the selling pressure could be losing strength.
- The MACD histogram is flat, showing no significant divergence, which means there is a lack of strong momentum in either direction.
This signals that POL could be approaching a point of reversal, especially if the MACD line crosses above the signal line. However, without a clear bullish signal, it’s best to remain cautious.
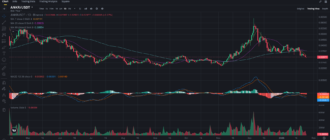
Volume Analysis: Low Activity
Looking at the volume data, the Volume SMA (9) is around 567.78K, which indicates relatively low trading activity. Low volume usually means that there is little interest from traders at the current price levels, and without an increase in volume, POL is unlikely to see major price swings.
That said, a sudden spike in volume could signal a reversal or continuation of the current trend. Traders should keep an eye on volume indicators for clues about any upcoming moves.
Recent News and Market Sentiment
While there hasn’t been any groundbreaking news directly related to POL, the broader crypto market has been experiencing fluctuations, largely driven by macroeconomic factors such as regulatory developments and overall market sentiment. Additionally, Polygon’s ongoing ecosystem development could play a role in boosting the token’s value in the future.
However, for now, the sentiment around POL remains cautious, with traders waiting for a clear signal before making their next moves.
Trading Strategies: How to Approach POL?
For Short-term Traders:
- Range Trading: With POL stuck between 0.3600 and 0.3727, a range-trading strategy could be employed. Buy at support near 0.3600 and sell at resistance around 0.3727. Place a stop-loss below 0.3550 to minimize risk.
- Breakout Strategy: If POL breaks above the 0.3727 resistance with strong volume, it could be a signal to enter a long position, targeting 0.3800 or higher. Conversely, a break below 0.3600 could offer a shorting opportunity down to 0.3500.
For Long-term Investors:
- Accumulate Strategy: If you believe in the long-term potential of Polygon’s ecosystem and the utility of POL, this could be an opportune moment to accumulate more tokens at a discount, especially near the 0.3600 support level.
- Hold Strategy: Investors who already hold POL may want to remain patient, as the token is in a consolidation phase. With positive news or market sentiment, POL could break out of its current range and deliver gains in the longer term.
Final Thoughts: POL’s Path Forward
POL is currently in a delicate position, hovering near support levels with the possibility of either bouncing back or continuing its decline. The technical indicators suggest that the token is in a consolidation phase, with weak bearish momentum. However, until POL breaks above key resistance levels like 0.3727 and 0.3800, the downtrend remains intact.
Short-term traders should focus on the 0.3600 support and 0.3727 resistance levels for potential trading opportunities, while long-term investors may see this as a chance to accumulate more tokens at lower prices.
Want to stay updated on the latest crypto insights? Follow my blog on Binance Square and join my Telegram channel for real-time analysis and market updates!