PepeCoin (PEPE) has been a hot topic in the meme-coin world, attracting traders and investors with its volatility and rapid price swings. Over the last few days, the price action of PEPE has shown signs of consolidation, and traders are now wondering: Is this just the calm before another explosive breakout, or are we in for a period of correction?
In this blog, we’ll break down the current PEPE chart, analyze the technical indicators, and provide some recommendations for both short-term traders and long-term investors.
PEPE’s Recent Price Movements
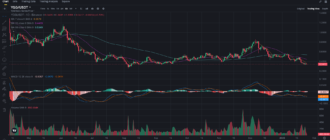
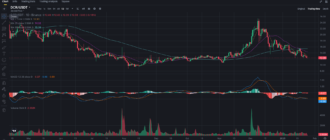
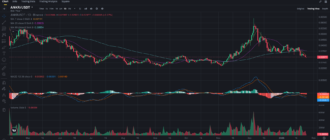
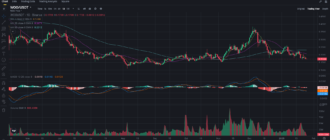
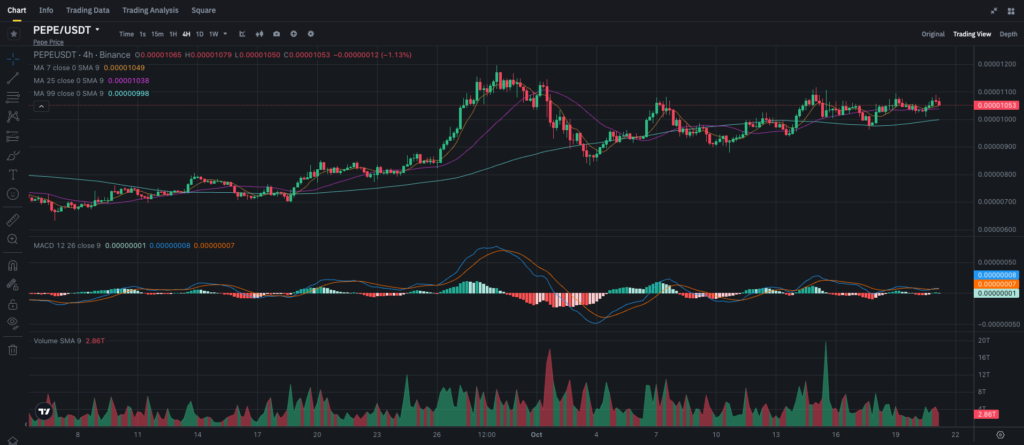
PepeCoin has had its fair share of ups and downs, and its price action continues to draw interest. A key observation from the 4-hour chart shows PEPE is struggling to maintain momentum after hitting its recent highs. The coin is hovering just above 0.00000105, a level that has acted as both support and resistance in the past, making it a critical juncture for the short-term direction of the asset.
While PEPE is still trading within a sideways range, this consolidation phase could either lead to a breakout or a breakdown, depending on broader market sentiment and technical signals.
Technical Analysis of PEPE
Key Support and Resistance Levels
- Immediate Resistance at 0.00000110: PEPE has faced difficulty breaking above the 0.00000110 mark. This level has become the immediate barrier for bulls to surpass. A clean break above this level could lead to a quick surge towards the next resistance at 0.00000120.
- Key Support at 0.00000100: The 0.00000100 mark is proving to be strong support, offering a safety net for the price. If PEPE breaks below this level, it could fall toward 0.00000090, where the 99-period SMA is located, providing additional long-term support.
Moving Averages: Neutral with Slight Bullish Bias
The 7-period SMA is at 0.00000105, and the 25-period SMA sits at 0.00000104, both slightly below the current price. This alignment indicates short-term support for the price. Meanwhile, the 99-period SMA at 0.00000099 is acting as a significant support level, confirming that the long-term trend remains somewhat bullish. As long as PEPE stays above the 99-period SMA, the coin remains in a neutral to bullish position.
MACD: Losing Momentum
The MACD indicator shows signs of weakening bullish momentum. The MACD line is just barely above the signal line, but the histogram is close to zero, signaling that the recent rally might be losing steam. This could mean that PEPE will either consolidate further or undergo a mild correction before attempting another rally.
Volume: Declining Participation
PEPE’s trading volume has seen a decrease in the last few sessions, with the 9-period SMA showing volume around 2.86T. This drop in volume is concerning, as it suggests that the price is consolidating without strong market participation. Traders should be cautious if volume continues to decline, as this could indicate a lack of interest in pushing the price higher.
Trading Strategies for PEPE
Short-Term Traders:
- Watch for a Break Above 0.00000110: If PEPE can break and close above 0.00000110, it could signal a short-term bullish breakout. Traders could look for a target around 0.00000120, setting tight stop-losses just below 0.00000100 to manage risk.
- Profit-Taking Near 0.00000105: If the price fails to break the 0.00000110 resistance, consider taking profits around 0.00000105. A failure to break resistance could lead to a retest of 0.00000100, and if that fails, a deeper correction toward 0.00000090 may follow.
Long-Term Investors:
- Accumulate Near 0.00000100: Long-term investors may want to accumulate more PEPE if the price dips near 0.00000100 or below. As long as the 99-period SMA at 0.00000099 holds, PEPE could still present a good buying opportunity for those willing to hold through short-term volatility.
- Hold for a Potential Long-Term Breakout: PEPE is still trading in a sideways pattern, but if the coin manages to break above 0.00000110, it could start a longer-term bullish trend. Long-term holders may want to continue holding, especially if the broader cryptocurrency market remains bullish.
What’s Driving PEPE’s Price?
While there hasn’t been any major fundamental news about PEPE recently, the meme-coin sector tends to be driven by community hype, market sentiment, and speculative trading. PEPE’s price movements are often tied to broader market trends, particularly in the meme-coin niche, where FOMO (Fear of Missing Out) and social media buzz can play a significant role in price action.
PEPE could also benefit from upcoming listings or integrations, but this is speculative at the moment. For now, technical analysis remains the primary tool for predicting short-term price movements.
Price Prediction for PEPE
Given the current chart setup, PEPE appears to be in a consolidation phase, with a potential breakout or breakdown in the coming days. If PEPE can break above the 0.00000110 resistance, we could see the price push towards 0.00000120, with a potential extension toward 0.00000130 if bullish momentum builds. However, if the price breaks below 0.00000100, a deeper correction toward 0.00000090 could occur.
In the best-case scenario, PEPE could reach 0.00000120 to 0.00000130 in the next week if volume and bullish momentum return. In a more bearish case, a dip toward 0.00000090 is possible, but long-term support at the 99-period SMA should hold unless there is a significant market-wide downturn.
Conclusion: Is PEPE a Buy Right Now?
PEPE’s current chart shows signs of both consolidation and potential upside. Traders should keep a close eye on the 0.00000110 resistance level, as a break above could lead to a bullish run. However, caution is advised, especially with the declining volume and MACD showing weakening momentum.
For short-term traders, a breakout above 0.00000110 offers an attractive opportunity, while long-term investors might consider accumulating near the 0.00000100 support level.
To stay updated on PEPE and other meme coins, make sure to follow my blog on Binance Square and join my Telegram channel for the latest crypto news and analysis.


