Pendle (PENDLE) Price Overview and Market Context
Pendle (PENDLE) has shown promising signs of upward momentum, trading at $5.15 as it consolidates after a recent rally. While the token has managed to stay above key support levels, it now faces potential resistance in its path to higher prices. This analysis examines the key support and resistance levels, technical indicators, and volume trends that are likely to influence Pendle’s price movement in the coming weeks.
Key Support and Resistance Levels
Pendle’s chart displays an interesting structure, with potential for both bullish and bearish scenarios depending on whether it can maintain key levels.
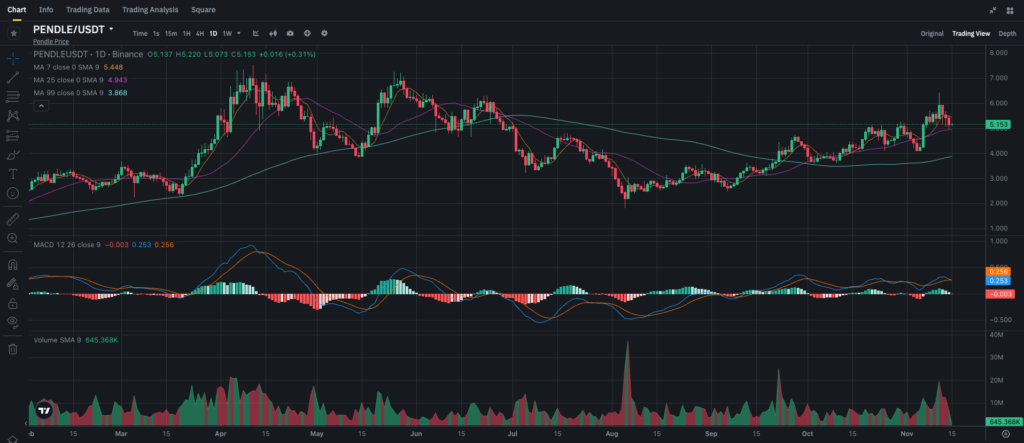
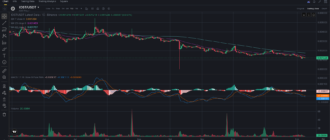
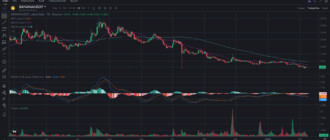
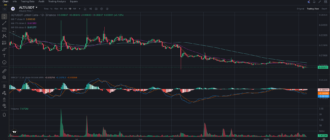
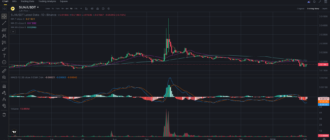
1D time frame, support at $5.0, resistance at $6.0 and $7.0. Indicators: 7, 25, and 99-day MA; MACD signal divergence.
Resistance Levels
• $6.0 – This level, close to the recent peak, serves as an immediate resistance. Breaking through this level would signal strong bullish momentum and could attract additional buyers.
• $7.0 – If Pendle successfully surpasses $6.0, $7.0 becomes the next resistance level, which could serve as a psychological barrier and attract profit-taking.
Support Levels
• $5.0 – The nearest support level, which has held up during recent pullbacks. If Pendle stays above this level, it may gain enough momentum for another upward push.
• $4.5 – A critical support level below $5.0, which previously served as a base for a rally. A break below $4.5 could indicate a weakening of the current uptrend.
Moving Averages Analysis
The daily chart includes the 7-day, 25-day, and 99-day moving averages (MAs), providing a broad perspective on Pendle’s trend across different time frames:
• 7-day MA (purple) at $5.45 – Pendle is trading below this short-term moving average, which may suggest short-term weakness. Regaining this level would indicate renewed short-term bullish sentiment.
• 25-day MA (green) at $4.97 – Pendle is above this medium-term MA, indicating that the price has maintained a medium-term upward trend.
• 99-day MA (blue) at $3.86 – The token remains well above the 99-day MA, suggesting that the long-term trend is still positive.
The bullish alignment of these moving averages, with the shorter-term MAs positioned above the longer-term MA, reflects an overall upward trend. However, a failure to break back above the 7-day MA could lead to further consolidation around current levels.
MACD Signals
The MACD (Moving Average Convergence Divergence) indicator, a popular tool for measuring market momentum, shows mixed signals on the PENDLE chart:
• The MACD line is slightly above the signal line, but only by a small margin, which suggests that the bullish momentum is weak.
• The histogram has been flat, indicating limited buying or selling strength.
The narrow gap between the MACD and signal line suggests that Pendle may be in a consolidation phase. A more decisive crossover, where the MACD line diverges further from the signal line, would provide a clearer indication of trend direction. Traders should monitor the MACD for any significant crossover as a sign of potential momentum shifts.
Volume Analysis
Volume patterns are also essential to Pendle’s price analysis. During the recent rally, trading volume increased, which usually signals genuine buying interest. However, volume has dropped slightly during the latest consolidation phase, which may indicate that market participants are hesitant to commit further at current levels.
For Pendle to sustain its upward movement and challenge higher resistance levels, an increase in trading volume would be necessary. Rising volume on an upward price move would suggest stronger demand and could support a sustained rally.
Recent News and Market Factors Affecting Pendle
Several developments and trends could be impacting Pendle’s price and influencing its potential for future gains:
1. Expansion in the DeFi Sector – Pendle is a decentralized finance (DeFi) protocol that offers yield trading and fixed-income products. The ongoing expansion of the DeFi sector has increased interest in platforms like Pendle, as investors seek more sophisticated yield opportunities.
2. Increased Focus on Yield Optimization – Pendle’s unique value proposition revolves around allowing users to trade future yield. As the broader DeFi market continues to grow, Pendle’s focus on yield optimization could drive more users to the platform.
3. Overall Crypto Market Sentiment – Pendle’s performance is partly influenced by the sentiment in the larger altcoin market. If the overall crypto market remains positive, Pendle could continue to benefit from these favorable conditions.
Price Forecast and Scenarios
Bullish Scenario
If Pendle holds above $5.0 and breaks above the $6.0 resistance level, it may have the momentum needed to rally toward $7.0. Breaking through $6.0 with strong volume would indicate that buyers are in control, signaling a continuation of the bullish trend.
Factors favoring this scenario:
• A positive divergence between the MACD and signal line.
• Rising trading volume as Pendle approaches key resistance levels.
If this bullish scenario plays out, Pendle could potentially target the $7.0 level or higher in the short term, especially if broader market sentiment supports risk-on behavior in the DeFi space.
Bearish Scenario
If Pendle fails to hold above $5.0 and loses support at this level, the price may retrace towards $4.5. A break below $4.5 could suggest that the recent uptrend is weakening, increasing the probability of further declines.
Factors favoring this scenario:
• Declining volume during rallies, indicating weakening buying interest.
• A bearish MACD crossover, where the MACD line dips below the signal line, signaling potential downward momentum.
In the bearish case, Pendle could test $4.0 to $4.5 as potential support levels, especially if broader market sentiment turns negative.
Trading and Investment Strategies
Short-Term Trading
For short-term traders, a break above $6.0 could offer a favorable entry point, with potential upside to $7.0. Traders may consider placing a stop-loss just below $5.5 to manage risk if momentum fails to hold. Conversely, if the price falls below $5.0, traders could consider shorting or exiting, targeting a retracement to $4.5.
Long-Term Investing
Long-term investors focused on Pendle’s DeFi utility may find current levels around $5.0 attractive for accumulating, especially if Pendle stabilizes above this level. Accumulating gradually could help mitigate risks associated with short-term volatility.
Alternatively, long-term investors might wait for a confirmed breakout above $6.0 as a signal of stronger market confidence before adding to their positions.
Final Thoughts
Pendle is at a critical juncture, with the potential for both upward and downward moves depending on whether it can break above resistance or hold support. While the MACD and volume patterns suggest cautious optimism, confirmation through higher volume and price stability at key levels would strengthen the bullish case.
Pendle is available for trading against USDT on Binance.

