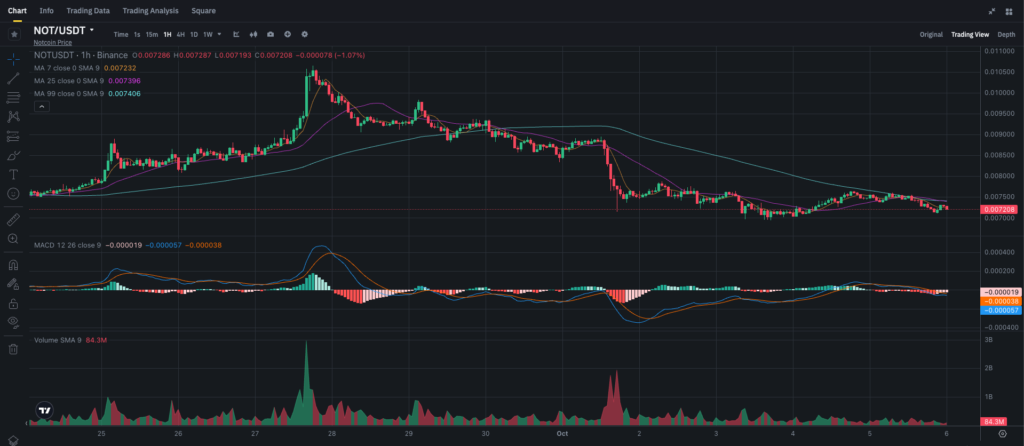
Notcoin (NOT) has recently caught the attention of traders due to its sharp declines and attempts at recovery. With a drop from $0.009 to $0.0072, the coin is struggling to regain momentum. Investors and traders are left wondering: is this just a temporary pullback or part of a longer downtrend?
In this analysis, we’ll dive into Notcoin’s current market behavior, explore the technical signals, and offer some insights on how traders can navigate this volatile environment.
Recent Price Action
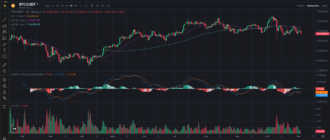
Notcoin’s price currently stands at $0.0072, a significant fall from its recent highs in late September when it was trading above $0.009. The 1-hour chart shows a gradual downtrend that started around October 1, with brief periods of consolidation.
The main question now is whether this level will serve as a bottom, or if there’s still more room for the price to fall. Let’s examine the key technical indicators to provide a clearer picture of what might happen next.
Technical Breakdown of Notcoin
Moving Averages
In the 1-hour chart, the 7-period SMA (Simple Moving Average) sits at $0.0072, nearly at the current price, which suggests that short-term sentiment is neutral but precarious. The 25-period SMA at $0.00739 is acting as immediate resistance, while the 99-period SMA at $0.0074 looms as a more significant longer-term barrier to any upward movement.
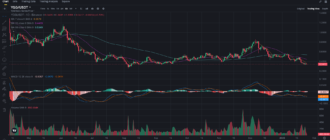
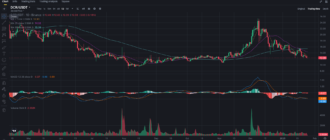
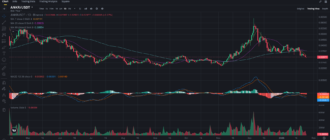
On the 4-hour chart, the 25-period SMA at $0.0073 is also serving as resistance, reinforcing the fact that Notcoin needs to break above these levels to even begin a meaningful recovery.
MACD Indicator
The MACD (Moving Average Convergence Divergence) on both the 1-hour and 4-hour charts are showing bearish signals. In the 1-hour chart, the MACD is slightly below zero, with the MACD line at -0.000019, below the signal line, indicating that the bearish trend could persist.
The 4-hour chart also paints a negative picture, with the MACD line below the signal line and the histogram showing increasing bearish momentum. This suggests that downward pressure is still present and could continue unless there’s a notable shift in market sentiment.
Volume Analysis
Volume levels are crucial in confirming trends, and in Notcoin’s case, we see some declining volume in recent days. The Volume SMA on the 1-hour chart stands at 84.3M, with no significant spikes, indicating low trading activity and a lack of buying interest.
For a reversal to take place, we would need to see a surge in volume, particularly during attempts to break through resistance levels.
Key Support and Resistance Levels
Support Levels
- $0.0070 – This is the immediate support level, which has held during recent pullbacks. A breakdown below this level could trigger another wave of selling pressure.
- $0.0068 – Another critical support zone that has held up during previous market downturns. If broken, we could see a deeper correction.
Resistance Levels
- $0.0074 – Immediate resistance, marked by the 99-period SMA on the 1-hour chart. A break above this could signal the start of a recovery.
- $0.0075 – A key resistance point that, if breached, could open the door for a move toward $0.0080.
Short-Term and Long-Term Outlook
Bullish Scenario
If Notcoin can break above the $0.0074 resistance level, it could signal a short-term bullish reversal. The next target would be $0.0075, a significant level that, if surpassed, could push the price towards $0.0080.
To confirm this bullish scenario, we would need to see increased trading volume and a bullish crossover on the MACD in the 1-hour chart.
Bearish Scenario
On the other hand, if Notcoin fails to hold the $0.0070 support level, it could quickly drop to $0.0068 or lower. The MACD’s current downward trajectory suggests that the bearish trend is still dominant, and a break below these levels could lead to a more extended period of selling.
Traders should keep an eye on the MACD histogram for signs of increasing bearish momentum, which could be a precursor to a further decline.
Consolidation Scenario
It’s also possible that Notcoin will continue to consolidate within the $0.0070-$0.0074 range for the coming days. This scenario would provide opportunities for scalpers to trade within this range, but it’s important to watch for any sudden price spikes that could indicate a breakout or breakdown.
Recommendations for Traders and Investors
For Short-Term Traders
- Bullish Entry: If Notcoin breaks above $0.0074 with strong volume, consider entering a long position with a target of $0.0075. Place a stop-loss just below $0.0070.
- Bearish Entry: If the price drops below $0.0070, look to short with a target of $0.0068 or lower. Use $0.0074 as a stop-loss level.
For Long-Term Investors
For those with a long-term investment horizon, the $0.0070 level could offer an attractive entry point if you believe in the fundamentals of Notcoin. However, given the current bearish trend, it may be wise to wait for a more definitive sign of reversal, such as a bullish crossover on the MACD and an increase in volume.
If you’re looking to accumulate more NOT during market dips, consider placing buy orders around the $0.0068 level, as this has been a strong support zone in the past.
Conclusion
Notcoin is currently stuck in a bearish phase, with the price trading below key moving averages and the MACD showing downward momentum. Traders should remain cautious as the coin is testing its $0.0070 support level, and a break below could lead to further declines.
For short-term traders, there are opportunities on both sides, depending on whether the price breaks above $0.0074 or falls below $0.0070. Long-term investors may want to wait for clearer signs of a trend reversal before committing to larger positions.
Stay tuned for more updates, and don’t forget to subscribe to my blog on Binance Square here for real-time insights and trading strategies!

