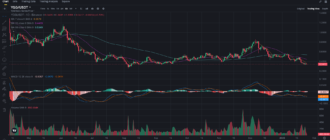
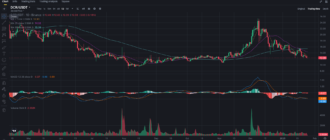
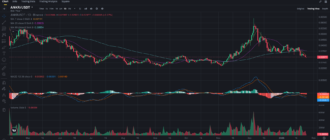
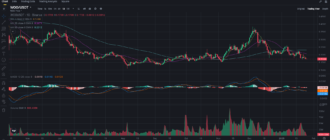
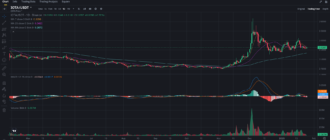
Litecoin (LTC) has recently seen some sideways action, leaving many traders wondering about the next move for this long-standing cryptocurrency. With the current price hovering around $65.55, the question on everyone’s mind is whether Litecoin can hold this level and bounce back, or if we are in for a deeper correction. In this analysis, we’ll dive into the latest LTC chart patterns, key technical levels, and trading strategies that could help traders navigate the market in the coming days.
Litecoin Price Overview: Support and Resistance
Key Support and Resistance Levels
- Support: The 99-period simple moving average (SMA) at $66.13 is a critical support level. A break below this would signal a potential drop towards $64.50, a price where significant buying pressure has occurred previously.
- Resistance: Litecoin faces strong resistance near $67.80, where it has struggled to gain traction in recent attempts. A clear break above this level could set the stage for a retest of $70 and beyond.
Moving Averages: Bearish Bias Still Present
- 7-period SMA at $65.80 is acting as short-term resistance. While Litecoin has been testing this level, it hasn’t been able to break through consistently, signaling possible weakness in the short term.
- 25-period SMA at $65.51 is another key support line. If LTC maintains its price above this, there may be room for a bounce toward $68.
- 99-period SMA at $66.13 is significant for long-term trends. Currently, Litecoin is moving below this indicator, which suggests that a stronger rally may not materialize without a recovery above this line.
The moving averages are reflecting a bearish trend as long as Litecoin trades below the $66–$67 range. A break above could indicate a shift in momentum.

MACD Analysis: Neutral to Bearish Signal
The MACD (Moving Average Convergence Divergence) indicator is offering mixed signals:
- The MACD line is just slightly positive at 0.04, while the signal line is flat at -0.04, reflecting indecision in the market.
- The MACD histogram is showing minor red bars, indicating a lack of bullish momentum at the moment.
The MACD suggests that Litecoin’s price may continue to consolidate in the short term. A stronger push in either direction will require more volume and a shift in market sentiment.
Volume Analysis: Weak Buying Pressure
The Volume SMA (9) shows a modest 1.767K, reflecting limited buying or selling interest at this price range. The lack of volume suggests that traders are waiting for more decisive signals before entering new positions. A significant spike in volume could be the key to unlocking a new trend.
Market Sentiment and News Impact on Litecoin
Litecoin, often referred to as the “silver to Bitcoin’s gold,” has seen fewer headlines recently. The broader market’s uncertainty due to global economic factors such as inflation, interest rate hikes, and regulatory concerns could be affecting Litecoin’s price action.
However, Litecoin’s upcoming halving event, slated for mid-2023, could be a significant catalyst for price movement. Historically, Litecoin halvings have been followed by substantial price increases due to reduced supply entering the market.
Trading Strategies: Short-term vs. Long-term
For Short-term Traders:
- Range-bound Strategy: Since Litecoin has been trading between $65 and $67, range traders might consider entering long positions near the $65 support level, with a stop-loss below $64.50 and a take-profit target around $67.
- Breakout Strategy: If Litecoin breaks below $64.50, traders could open short positions, targeting the next support at $62. Conversely, if LTC breaks above $67.80 with strong volume, going long could offer a target around $70.
For Long-term Investors:
- Accumulation Strategy: Long-term investors may view the current price as a good opportunity to accumulate Litecoin, especially if it holds the $64.50 level. With the upcoming halving event, the supply of Litecoin will decrease, potentially driving up prices in the medium to long term.
- Hold Strategy: Those already holding LTC for the long term might choose to stay patient, with the expectation that Litecoin could see a significant rally in the coming months as market conditions improve and halving hype builds.
Final Thoughts: Can Litecoin Hold $65?
While Litecoin currently faces strong resistance around $67, there is enough support at $65 to keep the price from falling too sharply in the short term. The technical indicators suggest that LTC is consolidating, but traders should be cautious as a breakdown below $64.50 could signal a more extended decline.
For now, short-term traders should focus on the $65-$67 range, while long-term investors might use any dips below $64.50 as opportunities to accumulate. The market is waiting for a catalyst, whether from macroeconomic events or Litecoin-specific developments, to move decisively in either direction.
Looking for more detailed crypto analysis and trading insights? Follow my blog on Binance Square for up-to-date market news, chart analysis, and strategic tips that can help you make informed decisions.


