Overview of the Chart and Current Market Context
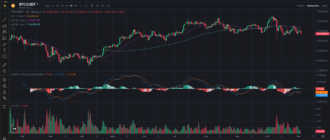
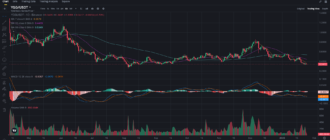
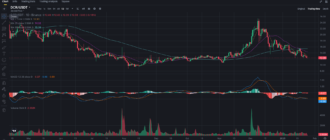
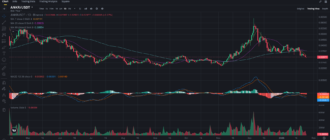
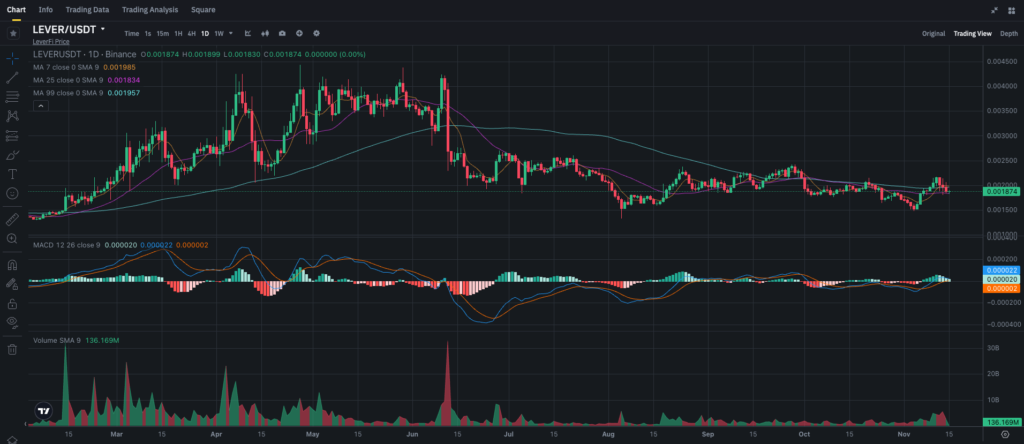
The daily chart for LEVER reveals significant volatility, marked by a few sharp rallies followed by retracements throughout 2023. Currently trading at $0.001874, LEVER has struggled to establish a strong upward trend and remains within a broader range, suggesting a phase of consolidation. The market appears to be testing key support and resistance levels, with moving averages and MACD signaling mixed momentum. This article dives into the technical analysis, highlighting critical support and resistance levels, potential scenarios, and actionable insights for traders and investors.
Key Support and Resistance Levels
Understanding crucial support and resistance levels is essential for gauging potential price movements and setting strategic entry and exit points:
- Immediate Support: $0.00180 – This level has recently acted as a support zone, helping to contain downside movement.
- Major Support: $0.00150 – This lower level has provided robust support during previous declines. A drop below it could signal a stronger bearish trend.
- Immediate Resistance: $0.00200 – Acting as a key resistance, this level has capped recent upward attempts. A break above it could indicate renewed bullish interest.
- Major Resistance: $0.00250 – This level represents a more substantial resistance, which, if broken, could pave the way for a sustained upward rally.
These support and resistance levels help to define the trading range for LEVER, with immediate support at $0.00180 and resistance at $0.00200 shaping the short-term outlook.
Moving Averages (MA) Analysis
The moving averages provide insight into LEVER’s trend direction and potential areas of support or resistance.
- 7-day MA (Short-Term): Positioned at $0.001985, this short-term moving average is slightly above the current price, acting as immediate resistance. LEVER needs to reclaim this level for a short-term bullish outlook.
- 25-day MA (Medium-Term): Located at $0.001834, the 25-day moving average is very close to the current price and may provide additional support. Holding above this level could attract buying interest.
- 99-day MA (Long-Term): At $0.001957, the 99-day moving average represents longer-term resistance. A sustained break above this level would be a bullish indicator, signaling a potential trend reversal.
With the price currently trading between the 25-day and 99-day MAs, LEVER is in a consolidation phase. Breaking above the 99-day MA would suggest a shift toward a bullish trend, while a drop below the 25-day MA could indicate a continuation of sideways movement or potential bearish pressure.
MACD Analysis
The MACD (Moving Average Convergence Divergence) indicator provides additional insights into LEVER’s momentum and potential trend direction.
- MACD Line: The MACD line is near the Signal line, reflecting low momentum and a lack of clear bullish or bearish control.
- Histogram: The histogram is nearly flat, indicating minimal momentum. This suggests that LEVER is in a period of consolidation, with neither buyers nor sellers dominating the market.
The MACD analysis confirms a neutral outlook, with no strong momentum in either direction. For a clearer trend signal, traders should watch for a MACD crossover or a more pronounced shift in the histogram.
External Market Factors Impacting LEVER
Broader Altcoin Market Sentiment
LEVER’s performance is affected by the broader sentiment in the altcoin market. While the overall crypto market has been mixed, with periods of optimism followed by corrections, a strong altcoin rally could provide the impetus needed for LEVER to break out of its current range. A positive shift in sentiment around DeFi and altcoin projects could attract additional investors to LEVER, given its association with the decentralized finance sector.
LeverFi Project-Specific Developments
As a DeFi-focused project, any developments within the LeverFi ecosystem, such as new partnerships, upgrades, or strategic moves, could impact the token’s performance. Any announcements related to LeverFi’s roadmap, technology upgrades, or user base expansion could generate renewed interest in LEVER, driving buying activity. Staying updated on LeverFi’s project news is essential for understanding potential catalysts.
Price Forecast and Potential Scenarios for LEVER
Based on the current technical indicators and market sentiment, LEVER’s price could follow several scenarios in the short term:
- Bullish Scenario: If LEVER breaks above the immediate resistance at $0.00200 with high volume, it could target the $0.00250 resistance as the next key level. A breakout above this threshold, combined with increased buying interest, would suggest a more substantial bullish shift, potentially paving the way for a longer uptrend.
- Neutral/Consolidation Scenario: If LEVER remains between $0.00180 and $0.00200, it may continue to consolidate. This range-bound behavior could indicate indecision, with traders waiting for stronger signals before making significant moves. In this case, monitoring volume and MACD signals for a potential breakout or breakdown will be essential.
- Bearish Scenario: If the price falls below the $0.00180 support level, it could retest the $0.00150 support. A break below this level would indicate continued bearish pressure, possibly leading to increased selling activity and lower lows.
Trading and Investment Insights
For Short-Term Traders
Short-term traders could consider entering a position if LEVER breaks above $0.00200 with strong volume, targeting $0.00250 as a potential profit level. To manage risk, a stop-loss just below $0.00180 can be set to minimize potential losses in case of a price reversal. If LEVER struggles to break resistance at $0.00200, traders may want to wait for a clearer breakout signal.
For Long-Term Investors
Long-term investors may see value in accumulating LEVER if it holds above the 25-day moving average. Accumulating near support levels like $0.00180 or even $0.00150 (if the price dips further) could provide favorable entry points for those looking to hold the asset over a longer horizon. Given LeverFi’s role in the DeFi sector, long-term investors might consider these levels as potential accumulation zones if they believe in the project’s future growth.
Conclusion
LEVER currently displays a consolidative pattern with support around $0.00180 and resistance at $0.00200. The MACD and moving averages suggest neutral to slightly bullish momentum, though a breakout above $0.00200 is necessary to confirm a more substantial uptrend. LEVER’s price action in the near term will likely depend on overall market conditions, particularly in the altcoin and DeFi sectors, as well as any project-specific news from LeverFi.
LEVER is available for trading on Binance in a USDT pairing, providing liquidity for both short-term and long-term investors.

