JTO has been capturing traders’ attention lately, as its price action shows signs of volatility that could either lead to a bullish breakout or a consolidation phase. With a series of price fluctuations and recent support tests, it’s an intriguing moment for JTO investors. Let’s break down the technical indicators and market sentiment to get a clearer view of what might come next for JTO.
Recent Price Movement Overview
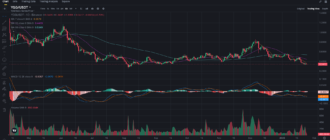
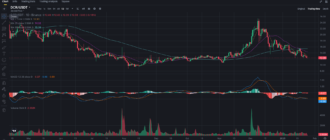
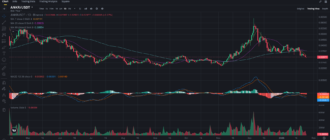
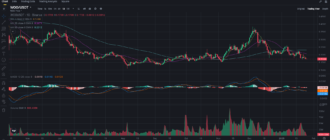
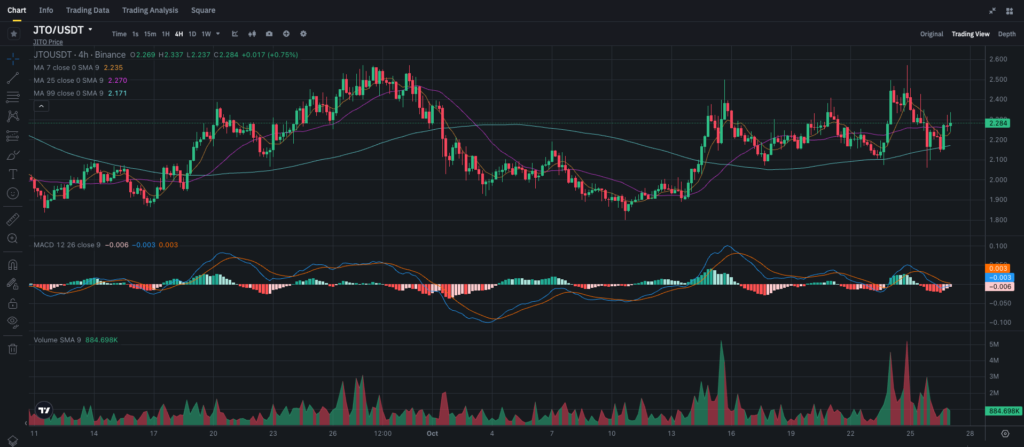
JTO has shown significant price movements over the past few weeks. The price peaked at around $2.60 earlier this month before correcting to the $2.10 range. Currently, it trades at approximately $2.28, where it’s testing resistance levels around the 25-period Simple Moving Average (SMA). The recent recovery from the $2.10 support level suggests that buyers are stepping in, but whether this momentum can carry forward remains uncertain.
Technical Indicator Analysis
Simple Moving Averages (SMA)
• 7-Period SMA: The 7-SMA is currently at $2.235, slightly below the price level, providing immediate support. The positioning of the 7-SMA above the 25-SMA signals short-term bullish momentum. However, the gap isn’t wide, meaning the trend could change quickly if selling pressure increases.
• 25-Period SMA: Located at $2.270, the 25-SMA is acting as a minor resistance level. For JTO to sustain its upward momentum, it needs to break above this level decisively. A close above the 25-SMA with increasing volume would strengthen the bullish outlook.
• 99-Period SMA: The long-term SMA is positioned at $2.171, well below the current price, offering a robust support zone. The slope of the 99-SMA suggests a generally upward long-term trend, indicating that JTO remains in an overall uptrend despite recent pullbacks.
MACD (Moving Average Convergence Divergence)
The MACD indicator is showing a mixed picture. The MACD line recently crossed above the signal line, suggesting a potential bullish reversal. However, the histogram bars remain small, indicating that the momentum isn’t very strong at this point. If the MACD line continues moving upward, accompanied by larger green bars on the histogram, it would confirm the strength of the ongoing uptrend. Conversely, a crossover below the signal line could signal a short-term correction.
Volume Analysis
Trading volume has been fluctuating, with a noticeable spike during the recent recovery from the $2.10 level. This indicates that there is interest from buyers at lower levels, supporting the current price range. However, for a bullish breakout above the $2.27 resistance, JTO needs to see a consistent increase in volume. If volume drops while the price remains flat or falls, it could be a sign that JTO is entering a consolidation phase.
Key Support and Resistance Levels
• Support Levels:
• Immediate support is at $2.235, aligning with the 7-SMA. If the price breaks below this level, the next significant support zone is at $2.171, near the 99-SMA. This level would be critical in maintaining the long-term uptrend.
• Resistance Levels:
• The primary resistance stands at $2.270, marked by the 25-SMA. A break above this level could open the door for JTO to retest the $2.60 level seen earlier this month. However, if JTO fails to breach this resistance, it may struggle and retrace to lower support levels.
Market Sentiment and Broader Trends
JTO’s price action is consistent with the broader market sentiment, where altcoins are experiencing a mix of volatility and consolidation phases. The recent movement suggests a cautious optimism, with buyers stepping in at lower levels. However, any negative news or broader market correction could quickly turn sentiment bearish, leading to a pullback to the $2.10 or even lower.
Trading and Investment Strategies
For Short-Term Traders
Short-term traders should keep a close watch on the $2.270 resistance level. A confirmed breakout above this level with substantial volume could provide an opportunity for a long trade, targeting the $2.60 level. However, it’s essential to set stop-losses below the $2.171 support level to manage risks if the price retraces.
For Long-Term Investors
Long-term investors might consider accumulating JTO if the price dips to the $2.10 or $2.171 levels. These points represent strong support zones, and with JTO’s potential in the broader crypto space, dollar-cost averaging at these levels could offer good entry points. As always, it’s important for investors to remain mindful of the overall market sentiment and macroeconomic factors that could impact JTO’s performance.
Price Prediction
If JTO successfully breaks above the $2.270 resistance, we could see the price moving back toward the $2.60 level. However, if the resistance holds and JTO fails to gain bullish momentum, a retest of the $2.10 support level is likely. Traders and investors should keep an eye on volume levels, as they will be a crucial indicator for either a breakout or a consolidation phase.
Conclusion
JTO’s price is at a critical point. The short-term indicators suggest that a bullish breakout is possible if resistance levels are breached with strong volume support. However, caution is necessary, as failure to move above $2.270 could result in a retracement. Short-term traders should wait for confirmation of a breakout before taking positions, while long-term investors could look to accumulate on dips. As always, proper risk management and careful monitoring of key levels are essential.
For more insights and detailed analysis on the latest crypto trends, make sure to follow my blog on Binance Square here and stay connected via my Telegram channel for real-time updates here.


