IOST is a long-standing crypto project that has gone through several full market cycles, including periods of strong expansion and extended decline. In earlier years, the network drew attention for its scalability focus and infrastructure-oriented design, but market interest gradually faded over time. Entering 2026, IOST trades near multi-year lows, making the 2026 price forecast highly dependent on whether the asset can exit its prolonged bearish phase. Current price action reflects a market in waiting mode rather than active accumulation.
IOST technical analysis: daily chart and trend structure
This technical analysis is based on the 1D timeframe. The latest completed candle is February 9, 2026, 02:00 UTC. On the daily chart, IOST remains in a bearish structure defined by lower highs and lower lows, formed after momentum weakened in the second half of last year.
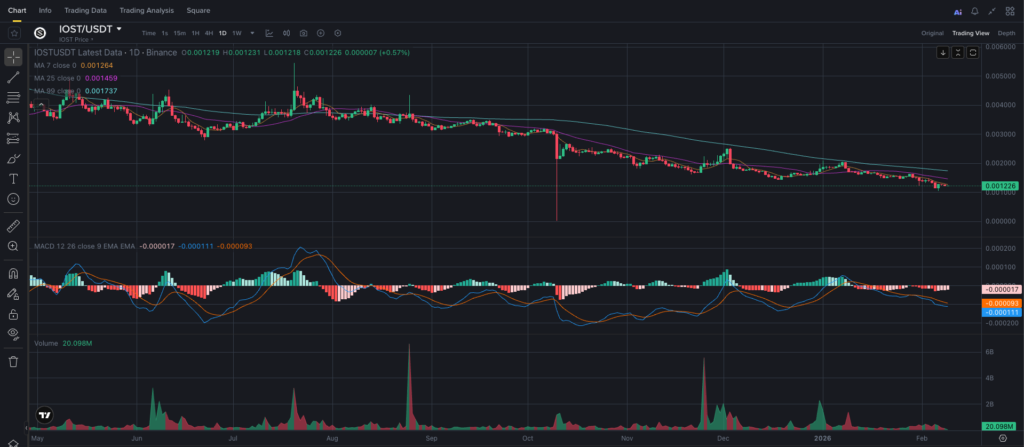
Following an extended consolidation phase, the market transitioned into accelerated downside movement, culminating in a sharp sell-off during autumn. Since then, price has failed to reclaim bullish structure, with all rebounds remaining corrective. Current price behavior is orderly and low-volatility, often seen in the later stages of bearish cycles.
IOST support and resistance levels
The primary support zone sits around $0.00115–0.00120, where price is consolidating in early 2026. This area has repeatedly absorbed selling pressure, forming a local demand zone.
If this support fails, the next downside reference lies near $0.00085–0.00095, aligned with deeper historical price levels. On the upside, immediate resistance is found around $0.00145–0.00155, followed by a stronger supply zone near $0.00170–0.00185, where long-term dynamic resistance converges.
Moving averages and market direction
The chart uses MA 7, MA 25, and MA 99. Short- and mid-term averages remain below the long-term MA(99), with negative slopes across the board. This configuration confirms sustained bearish control in the medium term.
Short-term bullish crosses have appeared, but without volume confirmation they faded quickly. A meaningful reversal would require sustained price action above MA(99) and a shift in its slope.
MACD and volume dynamics
MACD remains below the zero line, with the MACD line positioned under the signal line. The histogram shows small negative values that are gradually flattening, indicating weakening downside momentum without a confirmed trend reversal.
Volume has declined significantly compared to previous activity spikes. Recent sessions show steady but moderate trading, typical of prolonged consolidation phases lacking strong catalysts.
Short-term outlook for IOST
If price holds above the $0.00115–0.00120 zone, IOST may continue trading sideways with attempts to test $0.00145. A decisive breakdown would increase the probability of a move toward $0.00085–0.00095. As long as price remains below major resistance, upside moves appear technical rather than trend-driven.
IOST price prediction for 2026: scenario outlook
The base-case scenario for 2026 places IOST within a $0.0025–0.0040 range. This outcome becomes more likely if infrastructure-focused projects regain traction and network activity improves.
A more bullish scenario allows for expansion into the $0.0060–0.0090 zone, contingent on a sustained trend reversal, rising volumes, and renewed interest in legacy infrastructure solutions.
The bearish alternative scenario envisions continued pressure and price action within $0.0006–0.0009, should current support fail and broader market conditions remain weak.
Additional factors influencing IOST’s price
Recent market focus has shifted toward real usage and ecosystem viability. For IOST, network upgrades, developer engagement, and strategic repositioning efforts are key variables.
Macro conditions, regulatory developments, and competition from newer blockchain platforms also shape sentiment. Any developments that restore relevance could act as short-term catalysts.
Trading vs investing: how market participants may approach IOST
IOST currently trades within a prolonged downtrend showing early signs of stabilization. Volatility is low, and momentum remains subdued.
Short-term traders often monitor price reactions around key support and resistance zones, watching for failed breakdowns and volume shifts.
Long-term investors may view 2026 as a reassessment phase, gradually building exposure while waiting for structural confirmation.
Final thoughts on IOST in 2026
IOST enters 2026 after years of decline and an extended consolidation phase. While the technical picture remains cautiously bearish, signs of easing selling pressure are emerging. Any recovery will depend on renewed ecosystem relevance and the ability to reclaim key resistance levels. Under supportive conditions, upside scenarios remain possible, though downside risks persist. IOST is available on major exchanges including Binance, Bybit, and HTX.