Overview of the Chart and Current Market Context
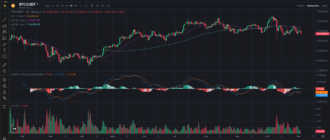
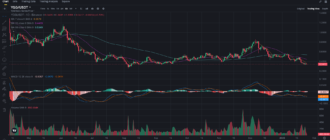
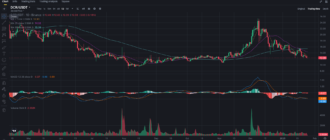
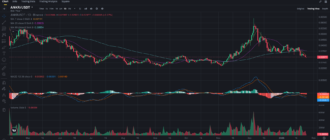
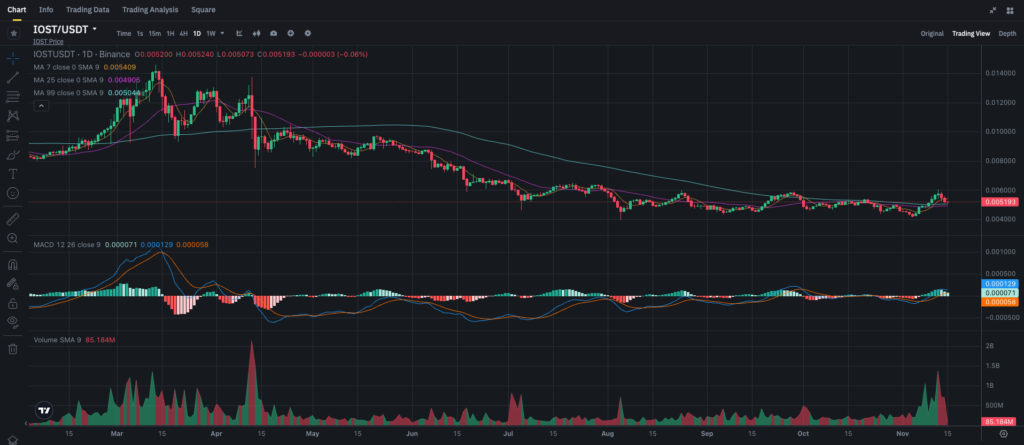
The daily chart for IOST shows a generally downward trend throughout 2023, marked by periods of sharp declines followed by consolidation phases. Currently, IOST is trading around $0.00519, showing signs of a modest recovery after a recent uptrend. The price has risen above some moving averages, hinting at potential short-term bullish momentum, but key resistance levels remain. Below, we’ll analyze the technical indicators, key support and resistance levels, and provide insights into potential price movements and trading strategies.
Key Support and Resistance Levels
Identifying critical support and resistance levels is crucial for understanding IOST’s potential price movements:
- Immediate Support: $0.0050 – This level aligns with the 7-day moving average and represents a short-term support that has provided stability over the past few days.
- Major Support: $0.0045 – If IOST falls below $0.0050, this level could serve as the next support, having previously acted as a floor during periods of consolidation.
- Immediate Resistance: $0.0055 – This level has acted as resistance in the recent rally and aligns with the current price action. Breaking above it could signal increased buying interest.
- Major Resistance: $0.0060 – If IOST can surpass $0.0055, this level may become the next target for bullish traders, marking a key threshold for further gains.
These levels define the current trading range, with $0.0050 as immediate support and $0.0055 as immediate resistance.
Moving Averages (MA) Analysis
Moving averages help to identify IOST’s trend direction and potential support or resistance levels.
- 7-day MA (Short-Term): Positioned at $0.0054, the 7-day moving average is currently just above the price, creating short-term resistance. For the uptrend to gain strength, IOST would need to break above this level.
- 25-day MA (Medium-Term): This moving average sits at $0.0049, which aligns with support. If the price holds above this level, it could signal a continuation of the recent bullish momentum.
- 99-day MA (Long-Term): The 99-day moving average is at $0.0054, close to the current price. Holding above this level could signal a potential shift toward a longer-term bullish trend.
With the price hovering near the 7-day and 99-day MAs, IOST’s immediate momentum appears mixed. A clear break above these levels would strengthen the case for continued upward movement, while a drop below could return IOST to a bearish phase.
MACD Analysis
The MACD (Moving Average Convergence Divergence) provides insights into momentum and potential shifts in trend.
- MACD Line: The MACD line is slightly above the Signal line, which indicates mild bullish momentum. This suggests that the recent upward movement may continue, though the signal is not strong.
- Histogram: The histogram shows diminishing green bars, reflecting a reduction in buying pressure. This could signal a potential weakening of the bullish trend unless the histogram turns positive again.
Overall, the MACD shows weak bullish momentum. If the MACD line continues to stay above the Signal line, it could sustain the recent uptrend, but if it crosses below, a retracement to support levels could occur.
External Market Factors Impacting IOST
Broader Crypto Market Sentiment
IOST, like many altcoins, is heavily influenced by the overall sentiment in the cryptocurrency market. As Bitcoin and other major cryptocurrencies continue to fluctuate, altcoins may see renewed interest if the general market trend turns bullish. A positive shift in sentiment for altcoins could bolster IOST’s upward momentum, especially if it breaks through key resistance levels.
Project-Specific Developments
IOST’s performance can also be impacted by news and updates within its ecosystem. Recent announcements, partnerships, or upgrades to the IOST network can positively influence investor sentiment, creating additional buying interest. Investors should stay updated on any project developments, as these could significantly impact short-term price action.
Price Forecast and Scenarios for IOST
Based on the technical analysis, IOST could follow several potential paths in the coming days and weeks:
- Bullish Scenario: If IOST breaks above the immediate resistance at $0.0055 and sustains that level, it may target the next resistance level at $0.0060. Increased volume and a positive crossover on the MACD would support this bullish case, potentially leading to further gains.
- Neutral/Consolidation Scenario: If IOST remains between $0.0050 and $0.0055, it may enter a phase of consolidation. This range-bound behavior would suggest that traders are waiting for stronger signals before committing to new positions. In this case, monitoring volume and MACD signals will be crucial for spotting a breakout or breakdown.
- Bearish Scenario: If the price falls below the $0.0050 support level, it may decline toward $0.0045. A drop below $0.0045 would indicate a continuation of the bearish trend, likely leading to increased selling pressure and lower lows.
Trading and Investment Insights
For Short-Term Traders
Short-term traders could look for entry points if IOST breaks above $0.0055 with rising volume, targeting $0.0060 as a potential profit-taking level. A stop-loss just below $0.0050 would help manage risk if the price reverses. If IOST struggles to break above resistance, it may be wise to wait for clearer signals before entering.
For Long-Term Investors
Long-term investors might consider accumulating IOST if it holds above the 99-day MA at $0.0054. This level could indicate the beginning of a more sustainable bullish trend. If the price retraces to $0.0045, it may offer an even more favorable entry point for those looking to accumulate with a long-term outlook.
Conclusion
IOST currently faces a mixed outlook with immediate support at $0.0050 and resistance at $0.0055. The MACD and moving averages suggest mild bullish momentum, but the signals are weak, and a clearer trend will depend on breaking above or below these critical levels. IOST’s future price movements will likely depend on broader market conditions and any positive developments within its ecosystem.
IOST is available for trading on Binance in a USDT pairing, making it accessible for both short-term and long-term investors.

