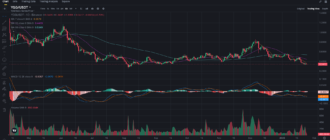
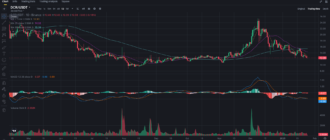
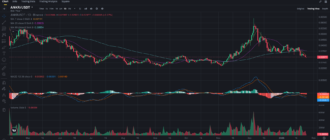
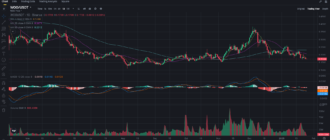
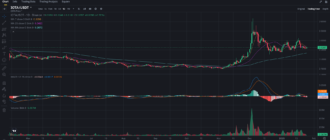
Internet Computer (ICP) has caught the eye of traders as it begins to show signs of a potential breakout after a long period of decline. With key technical indicators signaling a shift in momentum, ICP could be preparing for a move that investors shouldn’t ignore. Let’s dive into the recent price action, analyze the technical signals, and discuss what traders should look out for in the coming days.
Key Levels: Support and Resistance
As of this writing, ICP is trading at $8.08, a level that is crucial for understanding its next potential move. Let’s break down the key support and resistance levels:
Support Levels:
- $7.90: This level has provided strong support during recent dips, and it remains a key area to watch for buyers stepping in.
- $7.50: If the price drops below $7.90, the next major support level lies around $7.50, where ICP found stability during earlier corrections.
Resistance Levels:
- $8.20: ICP is facing immediate resistance at $8.20. A breakout above this level could lead to a stronger rally toward the next resistance.
- $8.50: The second major resistance stands at $8.50, where the 99-period SMA hovers. Breaking through this could open the path to more bullish momentum.
Moving Averages: Short-term Bullish Signals
ICP’s moving averages tell an interesting story. The chart shows that while ICP has struggled below key averages, it’s beginning to turn the corner:
- The 7-period SMA is currently at $8.04, just below the current price, indicating a short-term bullish trend. This could serve as a foundation for further gains if ICP holds this level.
- The 25-period SMA, located at $7.95, has already been broken, signaling that ICP is gaining strength in the medium term.
- However, the 99-period SMA at $8.23 is a critical level to watch. If ICP can break and hold above this level, it will signal a strong reversal from its previous downtrend.

MACD: Bullish Momentum is Building
The MACD (Moving Average Convergence Divergence) provides further evidence that ICP is preparing for a bullish move:
- The MACD line has crossed above the signal line, a classic bullish signal. With the MACD now in positive territory at 0.017, it suggests that buying momentum is increasing.
- The MACD histogram is in positive territory as well, which supports the idea that the bearish pressure is weakening, and the bulls are beginning to take control.
Volume: Is It Enough to Fuel the Rally?
Volume plays a crucial role in confirming price movements. The Volume SMA (9) is currently at 1.935K, which is a moderate level. Although the volume isn’t explosive, it is rising steadily. If ICP can maintain this volume or see an increase, it could provide the fuel needed for a breakout.
Recent Developments Influencing ICP’s Price
A few factors could influence ICP’s price action in the short term:
- Tech and Developer Activity: Internet Computer continues to build momentum with developers building decentralized applications (dApps) on its platform. Increased developer interest and growth in its ecosystem could positively impact ICP’s price.
- Market Sentiment: Like many altcoins, ICP’s price is influenced by overall market conditions. If Bitcoin and Ethereum continue their recent upward moves, ICP could benefit from the broader crypto sentiment.
- Partnerships and Integrations: Any announcement of major partnerships or integrations with DeFi or NFT platforms could also drive investor interest and price appreciation.
Trading and Investment Recommendations
For Short-term Traders:
- Range Trading: ICP is currently trading between $7.90 and $8.20. Traders can look to buy near support levels around $7.90 and sell near $8.20 for quick profits. Setting a stop-loss below $7.80 could help manage risk.
- Breakout Strategy: If ICP breaks above the $8.20 level, it could signal a larger rally. Traders can look to enter long positions with a target of $8.50 or higher. Be sure to watch for increased volume and confirmation from other indicators before jumping in.
For Long-term Investors:
- Accumulate on Dips: For long-term holders, accumulating ICP around $8.00 could be a strategic move. This price area represents a potential bottom, and with strong fundamentals, ICP could see significant gains in the future.
- Hodl Strategy: If you’re already holding ICP, sticking to a long-term plan might be the best course of action. The project’s continuous development and long-term potential could see the price appreciate substantially over time.
Conclusion: ICP Poised for a Breakout?
ICP is showing promising signs of a potential reversal, with key support holding and indicators like the MACD turning bullish. However, the real test lies at $8.20—a break above this level, supported by rising volume, could signal the start of a more sustained rally.
For now, short-term traders can focus on range trading, while long-term investors may find this a great opportunity to accumulate before a potential breakout. Keep a close eye on the $8.50 resistance level as a key area to target in the coming days.
Want more in-depth analysis and updates? Follow my blog on Binance Square for real-time insights, and join my Telegram channel for exclusive discussions and tips.


