Analysis of ICP’s Price Action and Indicators
Key Support and Resistance Levels
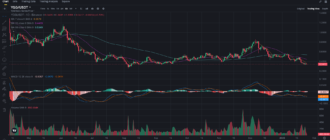
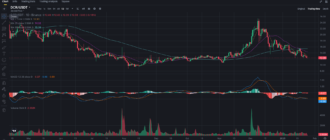
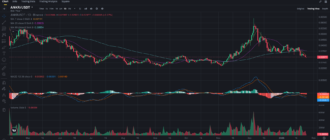
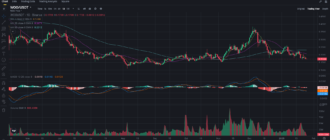
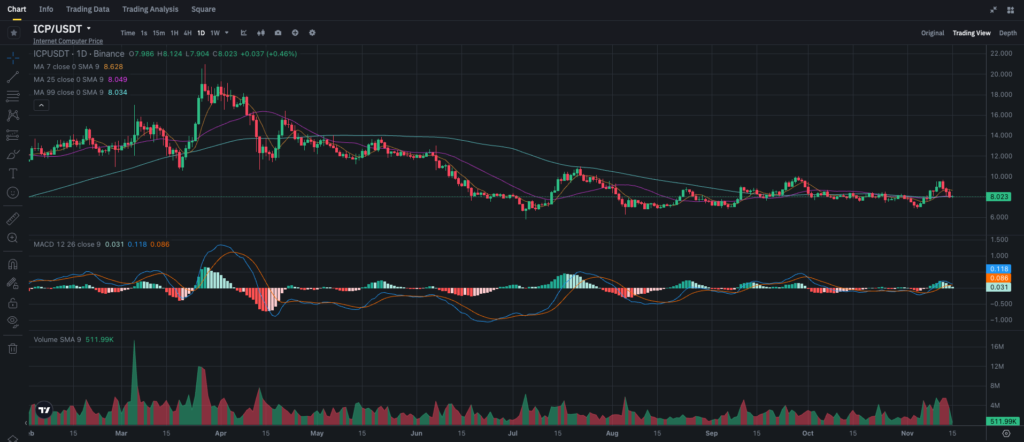
Looking at the daily chart for Internet Computer (ICP), the cryptocurrency has experienced a largely downward trend since the beginning of the year, with short-lived rallies failing to sustain higher levels. Presently, ICP is trading at $8.02, reflecting a consolidation phase in the broader downtrend. This level has become a significant pivot point, as the token repeatedly tests both the 25-day and 99-day moving averages.
The key resistance levels to watch are:
- $8.6 – This level, marked by the 7-day moving average (MA), has been a short-term resistance for ICP.
- $9.0 to $10.0 – This range has proven challenging for ICP to break through on multiple occasions over the past few months, and a break above it could signal a stronger upward momentum.
On the support side:
- $8.0 – The current level around $8 is acting as a support, where ICP has recently rebounded. A strong break below this level could result in a further decline.
- $6.5 to $7.0 – If $8.0 does not hold, this area is the next critical support zone, as it was where ICP saw a substantial buying response during previous pullbacks.
Moving Averages (MA) Analysis
The daily chart shows three moving averages:
- 7-day MA (purple) at $8.6
- 25-day MA (green) at $8.04
- 99-day MA (blue) at $9.0
The 7-day MA is currently above the 25-day MA, but both are still below the 99-day MA, indicating that short-term momentum is leaning bullish. However, the longer-term trend (99-day MA) remains a bearish signal, as ICP hasn’t broken above this level convincingly in recent months.
If ICP manages to break above the 99-day MA around $9.0, it could open doors to a significant rally, potentially challenging the $10 level. However, without this confirmation, there’s a risk of the price continuing to hover in the $8.0 range or potentially retracing downwards.
MACD Signals
The Moving Average Convergence Divergence (MACD), a common indicator of momentum, reveals mixed signals:
- The MACD line (blue) recently crossed above the signal line (orange), which is generally interpreted as a bullish indicator.
- The histogram shows positive momentum, but the MACD values are close to neutral, suggesting limited bullish strength.
This crossover suggests that ICP could experience a short-term upward push. However, given the weak momentum, it may struggle to break above the immediate resistance. For stronger signals, traders will be looking for the MACD to gain distance above the signal line and move further into positive territory.
Volume Analysis
Volume remains relatively low, with no substantial spikes indicating a surge in buying interest. Higher volumes are generally needed to sustain a rally. The current average trading volume around 511.99K suggests a lack of strong conviction among both buyers and sellers, which often results in range-bound or sideways price action.
In summary, low volume indicates that while the price may attempt a breakout, the probability of it sustaining without substantial buy support is low.
Latest News and Events Impacting ICP
Internet Computer (ICP) has attracted attention due to its ambitious vision to decentralize the internet, allowing developers to build applications directly on the blockchain without the need for traditional cloud services. Some recent developments influencing ICP include:
- New Developments in dApp Ecosystem – The DFINITY Foundation, which oversees ICP, has been working to expand the decentralized applications (dApps) ecosystem on Internet Computer. Recent dApp launches and partnerships may generate renewed interest in the token.
- Tokenomics Updates – Changes in ICP’s tokenomics or staking mechanisms could impact circulating supply. Lower supply in circulation tends to lead to price appreciation if demand remains constant or rises.
- Market Sentiment and Broader Trends – With a more cautious sentiment across the crypto market in 2024, ICP, like many altcoins, has struggled to attract significant investor interest. However, as market conditions stabilize, assets with strong fundamentals and unique value propositions, like ICP, could see renewed demand.
ICP’s unique position as a decentralized internet platform distinguishes it from other smart contract platforms, which may attract long-term investors looking for diversification in their portfolios.
Price Forecast and Scenarios
Given the mixed signals in the chart and indicators, here are two possible scenarios for ICP’s price movement in the coming weeks:
Bullish Scenario
If ICP successfully holds above the $8.0 support level and manages to break through the $9.0 resistance, it could enter a bullish trend. This breakout might attract more buyers and drive the price towards $10, where a major resistance level lies.
Indicators supporting the bullish scenario:
- A confirmed MACD crossover with an increasing histogram in positive territory.
- Higher trading volumes alongside upward price movement, indicating strong demand.
If ICP breaks above $9.0 with volume support, this move could attract momentum traders, leading to a potential rally towards $10.5 or even $12 in the best-case scenario.
Bearish Scenario
If ICP fails to hold the $8.0 support and bears gain control, the price may retrace back to the next support levels around $7.0 or even $6.5. The bearish scenario would be strengthened if:
- The MACD reverses, with the MACD line crossing below the signal line, showing a loss in momentum.
- A significant spike in selling volume occurs, confirming bearish sentiment.
Breaking below $8.0 without a swift recovery could signal a longer-term bearish continuation. In this case, ICP could struggle to regain its footing until it finds strong buying support around the $6.5 level.
Trading and Investment Strategies
Short-Term Trading
For short-term traders, the key level to watch is the $9.0 resistance. Traders might consider opening positions if the price breaks above this level with a volume spike, aiming for potential gains towards $10. In case of a rejection at $9.0, they may choose to exit positions and look for re-entry around $8.0 or $7.0.
Traders may also keep an eye on the MACD indicator: if it continues to diverge upwards, this could be a signal to hold positions in anticipation of further gains. However, caution is advised if the price moves below $8.0, as this may trigger a stronger bearish movement.
Long-Term Investing
Long-term investors focusing on ICP’s fundamentals may see current prices as an opportunity to accumulate, especially given its vision and the recent developments in decentralized internet applications. If ICP’s price dips further towards $7.0 or below, investors could consider this as an entry zone for dollar-cost averaging.
Alternatively, if ICP manages to establish a solid support above $10, this could indicate the beginning of a broader upward trend, making it an appealing point to add to long-term holdings.
Final Thoughts
Internet Computer (ICP) is in a consolidation phase, with both bullish and bearish indicators on its chart. While the technical signals are mixed, the project’s unique vision and recent ecosystem developments could attract renewed investor interest. Traders should watch the $8.0 to $9.0 range closely for confirmation of the next direction, while long-term investors might consider gradual accumulation if prices decline towards stronger support zones.
ICP is available for trading against USDT on Binance.


