Chart Overview and Current Market Status
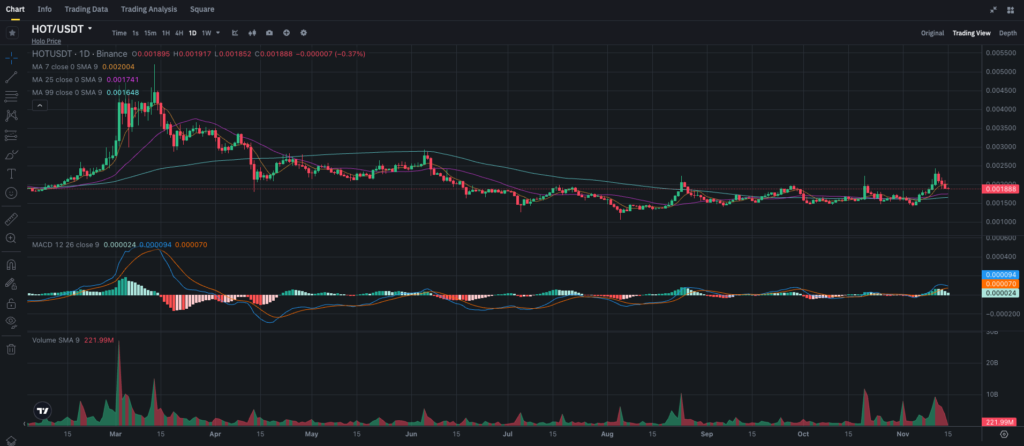
The daily chart for HOT (Holo) reveals a year marked by heavy volatility and an extended downtrend, typical of many altcoins in 2023. The price, currently around $0.00188, suggests that HOT has struggled to maintain upward momentum, but recent activity shows some stabilization. HOT’s price has experienced sporadic spikes, hinting at periodic buying interest. Let’s dig into the technical details to assess whether HOT can break higher or if a consolidation phase is more likely.
Key Support and Resistance Levels
Identifying significant support and resistance levels is crucial for understanding potential trading opportunities:
- Immediate Support: $0.00175 – This level has provided a cushion for the price, aligning with short-term moving averages.
- Major Support: $0.0015 – If HOT falls below this level, it could lead to further declines, indicating a bearish outlook.
- Key Resistance: $0.0020 – This resistance level aligns with recent price peaks, and breaking above it could trigger a short-term rally.
- Major Resistance: $0.0025 – A breakout above this level would suggest a more substantial bullish reversal.
With these levels identified, let’s look at the moving averages and MACD for a deeper analysis.
Moving Averages (MA) Analysis
Moving averages provide a clearer view of HOT’s trend over short, medium, and long-term periods.
- 7-day MA (Short-Term): The 7-day MA sits around $0.0020, above the current price, which indicates short-term bearish pressure. HOT will need to reclaim this level for a short-term bullish outlook.
- 25-day MA (Medium-Term): Positioned at $0.00174, this moving average has acted as support recently. Maintaining price action above this level could help support bullish sentiment.
- 99-day MA (Long-Term): Currently at $0.00168, this MA indicates that the overall long-term trend remains bearish. For a long-term shift, HOT needs to break and hold above this moving average, which could then become a strong support level.
The 7-day moving average positioned above the price suggests that immediate bullish momentum is waning. The fact that the 25-day MA is supporting the current price indicates some resilience in the medium term, but HOT will need sustained buying to challenge the 99-day MA and confirm any trend reversal.
MACD Analysis
The MACD (Moving Average Convergence Divergence) can help validate the momentum signals observed in the moving averages.
- MACD Line: The MACD line is slightly above the Signal line, signaling a slight bullish bias. However, the small gap indicates weak momentum, and a crossover below the Signal line would suggest a potential reversal.
- Histogram: The histogram is showing diminishing green bars, indicating a reduction in upward momentum. This aligns with the price struggling to break the $0.0020 resistance level.
The MACD analysis shows that while there is a slight bullish trend, momentum is fragile. Traders should watch for any MACD crossover, as it could signal either a continuation of the recent uptrend or the start of a new downtrend.
External Market Factors and News Influences
Market Sentiment and Altcoin Trends
Holo, like many other altcoins, is sensitive to overall market sentiment and trends in the altcoin sector. Currently, the broader crypto market is in a cautious state, with fluctuating volumes and mixed trends across different tokens. A resurgence of interest in altcoins could boost HOT’s price, especially if Holo releases significant updates or partnerships that could drive renewed interest.
Holo Network Developments
Project-specific news can significantly impact HOT’s market movements. Holo’s unique value proposition as a decentralized hosting platform makes it an appealing choice, especially if the platform experiences technological advancements or partnerships that enhance its utility. Any upcoming Holo network updates could positively influence HOT’s price, depending on market reception.
Price Forecast and Potential Scenarios
Given the analysis above, HOT could follow several potential price paths:
- Bullish Scenario: If HOT can break above the $0.0020 resistance and hold that level with increased volume, it may test the $0.0025 resistance. Sustained momentum could drive HOT towards $0.0030, though this would require strong external support, such as broader altcoin market gains or positive Holo network developments.
- Neutral Scenario: If HOT consolidates between $0.00175 and $0.0020, it might enter a phase of sideways trading. This scenario could indicate that the market is waiting for clear signals before making substantial moves in either direction.
- Bearish Scenario: A drop below the $0.00175 support could lead to a retest of the $0.0015 level, which would indicate bearish dominance. If selling pressure increases, HOT could fall below $0.0015, possibly leading to a prolonged downtrend.
Trading and Investment Insights
For Short-Term Traders
Short-term traders may look to open a position if HOT reclaims the $0.0020 level with strong buying volume. Stop-loss orders below $0.00175 could help manage risk. If HOT breaks above $0.0020, traders could target $0.0025 for a potential exit.
If HOT remains below $0.0020 without strong momentum, it may be best to hold off on short-term trades, as sideways movement could lead to unpredictable price action.
For Long-Term Investors
Long-term investors might consider accumulating HOT if it holds above $0.0015, as this could represent a buying opportunity in case of a broader market recovery. However, patience will be required, as HOT would need to establish a stronger bullish trend for a sustainable price increase. If the price rises above the 99-day MA, it could signal a more reliable entry point for long-term holding.
Conclusion
HOT currently faces resistance around the $0.0020 level and is supported by the $0.00175 and $0.0015 levels. Indicators suggest cautious optimism, but with signs of waning momentum, further consolidation or a retest of support may be likely before any significant move. HOT’s price action will largely depend on market conditions and developments within the Holo network.
HOT is available for trading on Binance in a USDT pairing, offering liquidity for both traders and investors. Binance

