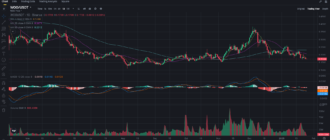
Overview of the Chart and Current Market Context
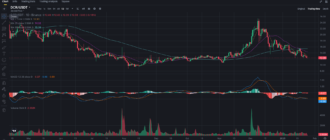
The daily chart for HIGH reveals a dramatic rise followed by a steep decline, with the current price around $1.378. After peaking near $10 in early 2023, HIGH has trended downward, showing weak momentum with occasional, short-lived rebounds. Now, HIGH appears to be consolidating near key support levels, suggesting that buyers and sellers are in a state of indecision. This article breaks down the technical indicators, identifies key support and resistance levels, and explores potential price scenarios.

Key Support and Resistance Levels
These levels will guide the trading range for HIGH, helping to anticipate potential breakout or breakdown points:
- Immediate Support: $1.30 – This level aligns closely with the 25-day moving average and has provided support in recent price action.
- Major Support: $1.00 – A psychologically important level that also represents a historical support zone. A drop below $1.00 could trigger further bearish sentiment.
- Immediate Resistance: $1.45 – This level aligns with the 7-day moving average and serves as the nearest resistance, which HIGH must break to build short-term bullish momentum.
- Major Resistance: $2.00 – A significant resistance level that, if surpassed, could signal a larger trend reversal.
These support and resistance levels define the boundaries for potential price action. $1.30 offers immediate support, while $1.45 is the resistance that, if broken, could pave the way for a move toward $2.00.
Moving Averages (MA) Analysis
The moving averages provide insight into the overall trend and potential support or resistance zones for HIGH.
- 7-day MA (Short-Term): Positioned at $1.43, this short-term moving average is acting as resistance. HIGH needs to reclaim this level to confirm any bullish shift.
- 25-day MA (Medium-Term): Located at $1.30, the 25-day moving average is providing a support level, which could attract buying interest if the price hovers around it.
- 99-day MA (Long-Term): Currently at $1.338, the 99-day moving average also acts as support, aligning closely with the current price. A hold above this level could signal that HIGH is stabilizing, but a drop below might reinforce the downtrend.
The moving averages suggest a consolidative to slightly bearish trend, with the price caught between the 7-day and 25-day MAs. For HIGH to shift to a more bullish outlook, it would need to hold above the 99-day MA and break the 7-day MA.
MACD Analysis
The MACD (Moving Average Convergence Divergence) indicator sheds light on HIGH’s momentum and potential trend shifts.
- MACD Line: The MACD line is slightly above the Signal line, indicating mild bullish momentum. However, the small gap between the two lines reflects a lack of strong buying pressure.
- Histogram: The histogram bars have been slightly positive but show limited growth, suggesting that bullish momentum is weak. This could lead to a consolidation phase if the histogram doesn’t expand.
The MACD analysis indicates that while there is some bullish momentum, it is not strong. A more pronounced upward histogram would be needed to confirm sustained buying interest.
External Market Factors Impacting HIGH
General Altcoin Market Sentiment
HIGH’s price action is influenced by the broader sentiment in the altcoin market. The crypto market has seen mixed trends recently, with fluctuations in both large-cap and small-cap coins. If general sentiment around altcoins turns positive, it could provide the momentum needed for HIGH to break above its immediate resistance levels. Conversely, a continued downturn in the altcoin market could maintain downward pressure on HIGH.
Project-Specific Developments
Any news or updates related to Highstreet’s development, partnerships, or network upgrades can impact its price. Highstreet has a focus on metaverse and NFT projects, which tend to be popular in the crypto space. Positive developments in these areas could renew interest in HIGH, potentially driving the price upward. Investors should stay alert for announcements that could impact HIGH’s short-term or long-term outlook.
Price Forecast and Scenarios for HIGH
Based on technical indicators and chart analysis, HIGH could follow several possible paths:
- Bullish Scenario: If HIGH can break above the immediate resistance at $1.45 with strong volume, it may target $2.00 as the next resistance. A confirmed breakout above $2.00 would indicate a more substantial bullish reversal, potentially paving the way for continued gains if broader market conditions remain supportive.
- Neutral/Consolidation Scenario: If HIGH remains between $1.30 and $1.45, it may consolidate within this range. This scenario would indicate a period of indecision, with neither bulls nor bears in control. Such a range-bound behavior might be a preparation phase before a larger move in either direction.
- Bearish Scenario: If HIGH fails to hold above the $1.30 support level, it could revisit the $1.00 mark. A breakdown below $1.00 would likely signal a bearish continuation, potentially leading to increased selling pressure as traders lose confidence in the asset’s ability to rebound.
Trading and Investment Insights
For Short-Term Traders
Short-term traders could look for an entry if HIGH breaks above $1.45 with substantial volume, targeting $2.00 as a potential profit-taking level. To manage risk, a stop-loss could be placed slightly below $1.30 to prevent losses in case of a trend reversal. If HIGH fails to break resistance at $1.45, traders may prefer to wait for a clearer breakout signal.
For Long-Term Investors
Long-term investors might consider accumulating HIGH if it remains above the 99-day moving average, as this could signal stability and the potential for gradual recovery. Accumulating at or near support levels around $1.30 or even $1.00 (if the price dips further) could provide more favorable entry points. Investors with a long-term outlook may find these levels appealing, especially if the project makes progress within the metaverse or NFT spaces.
Conclusion
HIGH is currently in a consolidative phase with support around $1.30 and resistance at $1.45. The MACD and moving averages suggest mild bullish momentum, but the signals are not strong enough to confirm a full-fledged uptrend. Whether HIGH can break out of its current range will likely depend on broader market sentiment and any project-specific developments that could attract investor interest.
HIGH is available for trading on Binance in a USDT pairing, making it accessible for both short-term and long-term traders.

