Chart Overview and Market Context
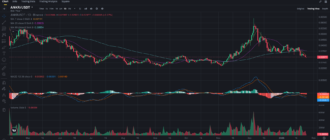
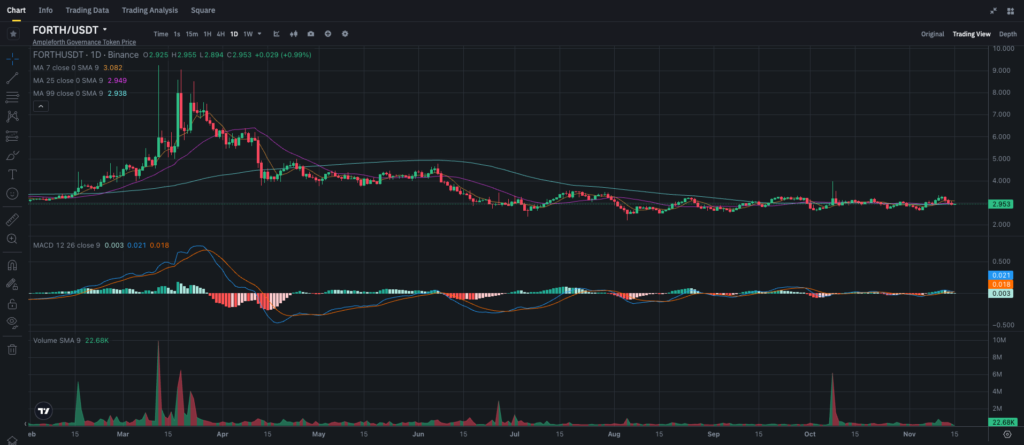
The daily chart for FORTH, the governance token for Ampleforth, shows an initial spike earlier in the year, followed by a prolonged downtrend and recent consolidation. Currently trading at $2.953, FORTH has been relatively stable but lacks strong momentum, with slight fluctuations around key moving averages. The overall technical picture suggests a phase of low volatility, indicating potential consolidation before a decisive move. This analysis will explore key support and resistance levels, interpret technical indicators, and present possible scenarios for the future direction of FORTH.
Key Support and Resistance Levels
Identifying support and resistance levels is essential to understanding the possible trading range and breakout points:
- Immediate Support: $2.90 – This level has been tested multiple times, serving as short-term support.
- Major Support: $2.50 – A more substantial support level, which has historically provided a strong floor for price drops.
- Immediate Resistance: $3.10 – Aligned with the 7-day moving average, this level could act as the first resistance point.
- Major Resistance: $3.50 – A significant resistance level; breaking above it could signal the start of a potential uptrend.
These support and resistance levels define the short-term trading range for FORTH. A break above $3.10 could initiate bullish sentiment, while a move below $2.90 might trigger further bearish movement.
Moving Averages (MA) Analysis
The moving averages help identify FORTH’s trend direction and potential support or resistance areas:
- 7-day MA (Short-Term): Positioned at $3.08, the 7-day moving average represents immediate resistance. For any bullish momentum, the price would need to break above this level.
- 25-day MA (Medium-Term): Currently at $2.949, this moving average is close to the current price and acts as support, keeping FORTH within a consolidation phase.
- 99-day MA (Long-Term): Positioned at $2.938, the 99-day moving average also serves as support, suggesting that the price is stabilizing near long-term support levels.
The price is currently oscillating near the 7-day, 25-day, and 99-day moving averages, which indicates a consolidative trend. FORTH would need to sustain movement above the 7-day MA for a more convincing bullish reversal.
MACD Analysis
The MACD (Moving Average Convergence Divergence) indicator provides insights into the momentum of FORTH’s price:
- MACD Line: The MACD line is slightly above the Signal line, reflecting mild bullish sentiment but with limited strength.
- Histogram: The histogram shows a few green bars, suggesting weak bullish momentum. The lack of growth in the histogram bars implies that buying pressure is limited, indicating potential sideways movement.
Overall, the MACD analysis supports a neutral to slightly bullish outlook, though the weak histogram suggests that momentum may not be strong enough for a major breakout without a surge in buying interest.
External Factors Impacting FORTH
Broader Market Sentiment in DeFi and Altcoins
FORTH is part of the broader DeFi and altcoin markets, and its price is influenced by trends in these sectors. If there is renewed interest in DeFi or increased positive sentiment in the altcoin market, it could provide the necessary boost for FORTH to break out of its consolidation phase. Conversely, negative sentiment or a downturn in the DeFi sector could add downward pressure.
Developments in the Ampleforth Ecosystem
As the governance token for Ampleforth, FORTH’s value is tied to developments within the Ampleforth ecosystem. Announcements related to new partnerships, updates, or expansions of Ampleforth’s functionalities could impact investor sentiment and drive the price of FORTH. Positive news in the project could bring more interest and buying pressure, potentially moving the price above resistance levels.
Price Forecast and Potential Scenarios for FORTH
Based on the current technical setup, FORTH’s price could follow several potential scenarios in the short term:
- Bullish Scenario: If FORTH breaks above the immediate resistance level at $3.10 with strong volume, it could target $3.50 as the next key resistance. A breakout above $3.50 would confirm a more substantial bullish trend, potentially leading to further gains if market conditions remain supportive.
- Neutral/Consolidation Scenario: If FORTH remains between $2.90 and $3.10, it may continue to consolidate. This sideways action would suggest indecision among traders, and monitoring volume and MACD for a breakout or breakdown signal would be essential.
- Bearish Scenario: If FORTH falls below the $2.90 support level, it could test the $2.50 support zone. A break below $2.50 would signal bearish continuation, likely leading to increased selling pressure as the token loses its long-term support.
Trading and Investment Insights
For Short-Term Traders
Short-term traders might consider entering a position if FORTH breaks above $3.10 with rising volume, targeting $3.50 as a profit level. Setting a stop-loss around $2.90 would help manage risk in case of a reversal. If FORTH struggles to surpass $3.10, traders may prefer to wait for clearer signals before committing to a position.
For Long-Term Investors
Long-term investors may see value in accumulating FORTH around the $2.90 support level, as this price point aligns with the 99-day moving average, which could indicate stability. If the price moves down toward $2.50, it may present an even more attractive entry point for investors with a long-term perspective. Those who believe in Ampleforth’s role in DeFi may consider these levels favorable for gradual accumulation.
Conclusion
FORTH’s current price action indicates a phase of consolidation, with key support at $2.90 and resistance at $3.10. The MACD and moving averages suggest neutral to mildly bullish momentum, but the signals are not strong enough to confirm a clear trend. Whether FORTH can break out of its current range will depend on broader market sentiment, especially within DeFi, and any project-specific developments from Ampleforth.
FORTH is available for trading on Binance in a USDT pairing, offering liquidity for both short-term traders and long-term investors.

