Overview of FLOKI’s Market Position
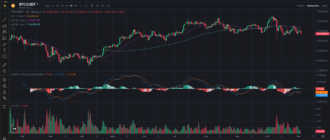
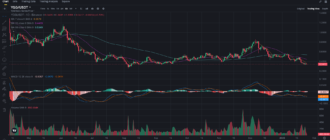
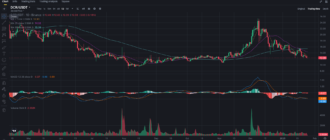
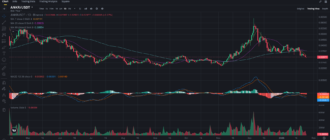
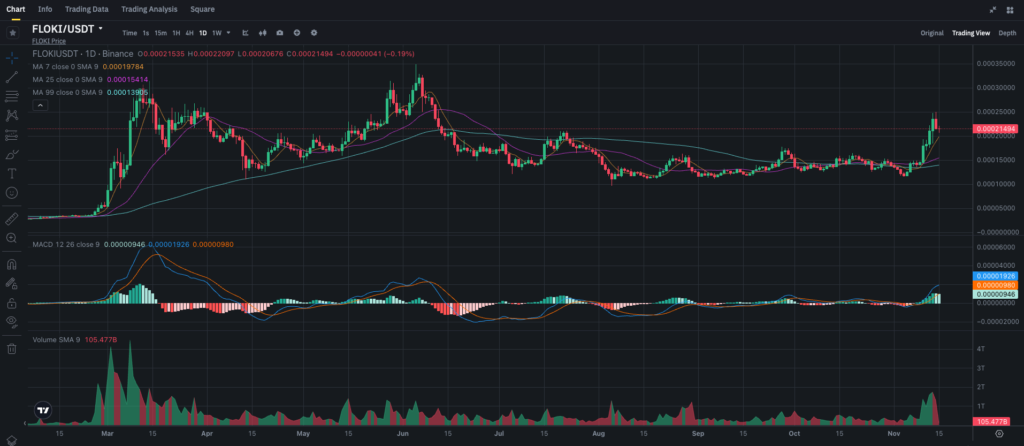
FLOKI has recently experienced a surge in trading interest, with its price breaking through several key levels, now trading around 0.00021494. This recent move has brought FLOKI into the spotlight as it challenges both its past highs and current market resistance levels. The question for traders and investors is whether FLOKI can sustain its bullish momentum or if a correction is on the horizon. In this analysis, we’ll dive into the key technical indicators, support and resistance levels, and potential trading scenarios for FLOKI.
Key Support and Resistance Levels
Identifying critical levels helps gauge the strength of FLOKI’s price movement:
- Immediate Support: 0.00019784 – Located near the 7-day moving average, this level could act as a short-term support.
- Major Support: 0.00015414 – Near the 25-day moving average, representing a stronger foundational level.
- Immediate Resistance: 0.00022000 – A psychological level where recent price movements are testing resistance.
- Major Resistance: 0.00025000 – Breaking this level could signify a breakout and may lead to additional upward momentum.
FLOKI’s ability to hold support at these levels and break through resistance will determine its short-term trend.
Moving Averages (MA) Analysis
The moving averages provide insight into FLOKI’s trend strength and potential reversal points:
- 7-day MA: Currently at 0.00019784, it has recently acted as dynamic support. A fall below this level could indicate a potential pullback.
- 25-day MA: At 0.00015414, this medium-term average represents a more substantial support level, especially during high volatility.
- 99-day MA: Positioned at 0.00013905, the 99-day MA reflects FLOKI’s overall bullish trend for the year, showing support from long-term investors.
With FLOKI currently trading above all its moving averages, this indicates a solid bullish trend. A dip towards the 7-day or 25-day MAs could attract buying interest from traders looking for a lower entry point within the uptrend.
MACD Analysis
The MACD indicator highlights the strength of FLOKI’s momentum:
- MACD Line: The MACD line is trending positively above the Signal line, signaling strong upward momentum.
- Histogram: The histogram bars are currently in green, reflecting bullish sentiment. However, a narrowing histogram could indicate slowing momentum.
The MACD’s positive trend supports a bullish outlook, but the slight narrowing in the histogram suggests caution for traders expecting a straight move upward. Watching for any cross of the MACD line below the Signal line could hint at a possible trend reversal.
External Market Factors Impacting FLOKI
Growing Meme Coin Popularity
FLOKI, as a meme coin inspired by popular culture, benefits from market trends that favor speculative and community-driven assets. With similar assets experiencing high levels of interest, FLOKI’s price could be buoyed by general market sentiment toward meme coins. Monitoring news around meme coin rallies and social media interest can offer further insight into FLOKI’s potential movement.
General Crypto Market Sentiment
FLOKI’s price movements are also influenced by the broader market sentiment toward cryptocurrencies. Positive movement in major assets like Bitcoin and Ethereum can attract more investors to altcoins, including meme coins like FLOKI. Conversely, a downturn in the market could impact the current momentum.
Price Forecast and Potential Scenarios for FLOKI
Based on the technical indicators, here are the potential scenarios for FLOKI’s price in the near term:
- Bullish Breakout Scenario: If FLOKI can break above 0.00022000 with significant trading volume, it may retest the 0.00025000 resistance level. Breaking this level could push FLOKI to even higher levels, given strong market sentiment.
- Consolidation Scenario: FLOKI might trade sideways between 0.00019784 and 0.00022000. This consolidation would allow the asset to establish a stable base before potentially moving higher.
- Pullback Scenario: If FLOKI falls below the immediate support at 0.00019784, it could test the 0.00015414 level. A drop below this support might indicate a deeper correction within the trend.
Trading and Investment Insights
For Short-Term Traders
Short-term traders might consider entering if FLOKI breaks above 0.00022000, with a target toward 0.00025000. Setting a stop-loss near the 7-day MA around 0.00019784 can help manage risk in case of a sudden downturn. Alternatively, traders may look for a pullback to 0.00019784 for a lower-risk entry point.
For Long-Term Investors
Long-term investors may see value in accumulating FLOKI around the 0.00015414 level or even lower, depending on their risk tolerance. Investors who believe in FLOKI’s potential within the meme coin sector might consider adding positions during pullbacks, especially around the 25-day MA level. Long-term holders should remain cautious of volatility but could benefit from the growing interest in meme-based cryptocurrencies.
Conclusion
FLOKI is showing strong bullish momentum, with support levels around 0.00019784 and 0.00015414, and resistance at 0.00022000 and 0.00025000. The MACD and moving averages support a positive outlook, though a consolidation or minor pullback could occur.
FLOKI is available for trading on Binance in a USDT pairing, providing an accessible option for both traders and investors.

