Ethereum, the second-largest cryptocurrency by market cap, has been navigating a volatile market recently. After a sharp drop from the $2,700 level, ETH has found some stability near the $2,350-$2,400 range. But is this the calm before the storm, or are we about to witness a solid rebound? Let’s analyze the charts, look at key indicators, and assess what moves traders should be making right now.
Price Action and Key Levels
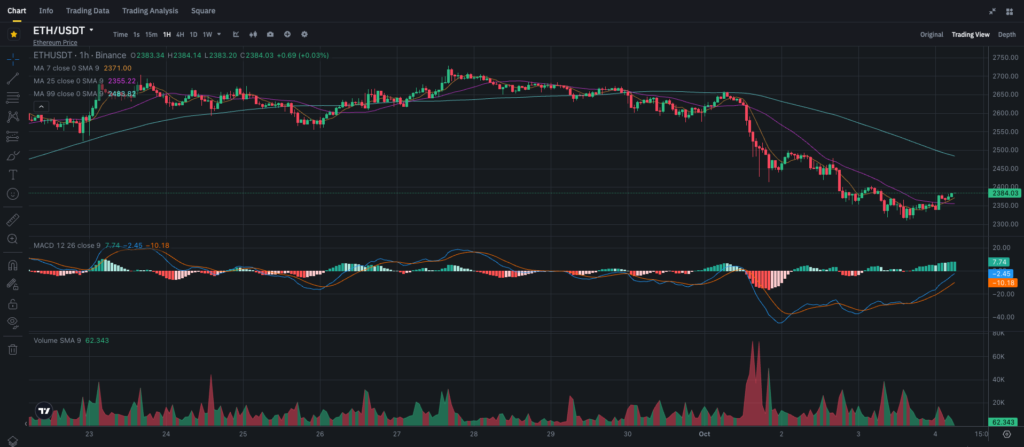
On the 1-hour chart, Ethereum appears to be stabilizing after a steep decline that saw it drop below $2,400. The price is now hovering around $2,384, with a slight upward trend forming. A glance at the 7-period Simple Moving Average (SMA) shows that ETH is testing resistance at $2,371, while the 25-period SMA around $2,355 is acting as a dynamic support. However, the 99-period SMA stands tall at $2,488, marking the next major resistance level that ETH will need to clear for any substantial rally to take place.
Zooming out to the 4-hour chart, Ethereum’s situation looks slightly more precarious. The 99-SMA, currently at $2,555, looms large as a major obstacle, and the price has been struggling to gain traction above the $2,500 mark. With ETH battling to break past these levels, we can see a clear range forming between $2,350 (support) and $2,550 (resistance). A breakout in either direction will likely dictate the next major price movement.
MACD Indicator – The Bulls Are Gaining Traction
The MACD (Moving Average Convergence Divergence) indicator on the 1-hour chart shows some early signs of a bullish reversal. While the MACD line is still below the signal line, we’re seeing some upward movement, with the histogram showing diminishing red bars. This suggests that selling pressure is weakening and buyers could soon gain the upper hand.
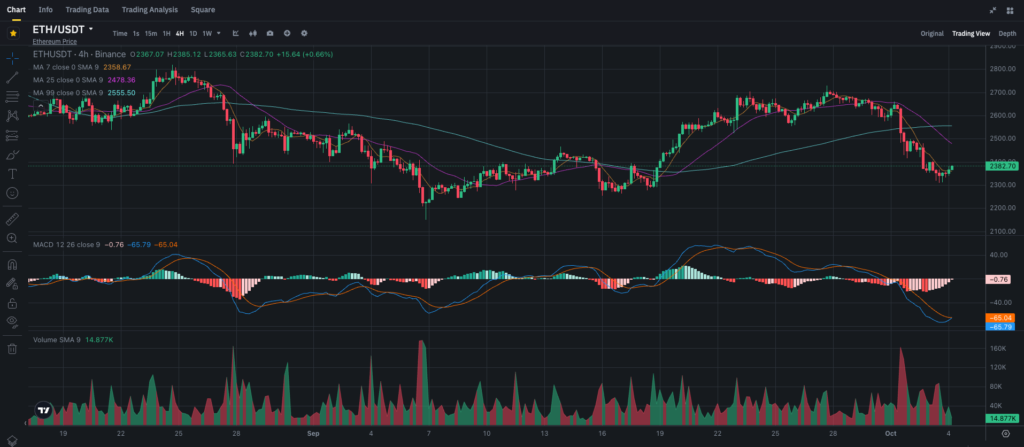
On the 4-hour chart, the MACD tells a more cautious story. Although the momentum has slowed, the MACD line is still deep in negative territory at -0.76, while the signal line trails closely at -65.04. This suggests that, although the bulls may soon regain control, the overall sentiment remains bearish for now, particularly in the medium term.
Support and Resistance Zones to Watch
- Immediate support: $2,350 – Ethereum has been finding support around this level, and a break below could send the price tumbling toward $2,300.
- Resistance: $2,488 – The 99-period SMA on the 1-hour chart represents a key resistance level. A break above this could open the door to a test of the $2,550 zone on the 4-hour chart.
Until ETH makes a decisive move above $2,500, traders should be cautious about opening long positions, as the broader market sentiment is still bearish.
Market Sentiment and Recent News
Ethereum’s price action has been influenced by broader market trends, particularly Bitcoin’s ongoing struggle around the $60,000 mark. When BTC shows weakness, Ethereum often follows suit, but the recent updates to Ethereum’s ecosystem—such as the continuing transition to Proof of Stake—are long-term bullish signals. Nevertheless, short-term volatility remains high.
Additionally, recent on-chain data from Binance shows an uptick in ETH trading volumes. This suggests that both institutional and retail investors are closely watching ETH’s price action, waiting for the right moment to enter.
Recommendations for Traders
Short-Term Traders:
For short-term traders, the current situation presents an interesting opportunity. If ETH continues to hold the $2,350 support, there’s a chance to ride a bounce towards the $2,488-$2,500 resistance zone. However, caution is warranted, as a failure to break above $2,500 could result in a sharp reversal back to $2,300 or lower.
If you’re considering a long position, you might want to wait for a confirmed break above the 99-SMA on the 1-hour chart to minimize risk. The MACD on the 1-hour timeframe is also a key indicator to watch—should it flip bullish, that could signal a good entry point for a short-term trade.
Long-Term Investors:
For those looking to hold ETH over the long term, this could be an excellent time to accumulate. Ethereum’s long-term fundamentals remain strong, and as the network continues to upgrade, its potential value grows. Long-term investors could consider dollar-cost averaging (DCA) into their positions, particularly if ETH drops below $2,350 again. With support building at these lower levels, it’s unlikely we’ll see a sustained dip much further, barring a significant market-wide event.
Conclusion: A Crucial Moment for Ethereum
Ethereum’s current price action is setting the stage for a major decision point. The support at $2,350 and the resistance at $2,488 represent two key levels that traders need to watch closely. A break above the 99-SMA on the 1-hour chart could send ETH rallying toward $2,550, while failure to hold the support might open the door to further declines.
Short-term traders should be ready to take advantage of quick moves, while long-term investors can look at this as an opportunity to accumulate on dips. The market is volatile, but ETH’s fundamentals remain as strong as ever.
Stay tuned to my blog for more Ethereum insights, price predictions, and market analyses. Don’t forget to subscribe and follow me on Binance Square at Binance Square to get daily updates and trade tips!

