EOS (EOS) Price Overview and Market Context
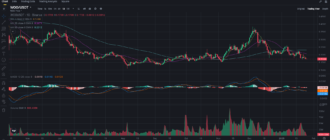
EOS has seen a moderate increase in price recently, with its value reaching $0.56 after a prolonged downtrend. Despite an extended bearish phase, recent developments and a slight uptick in market interest suggest that EOS may be building momentum. This analysis will explore the technical indicators, support and resistance levels, and recent market factors that could shape EOS’s price direction in the coming weeks.
Key Support and Resistance Levels
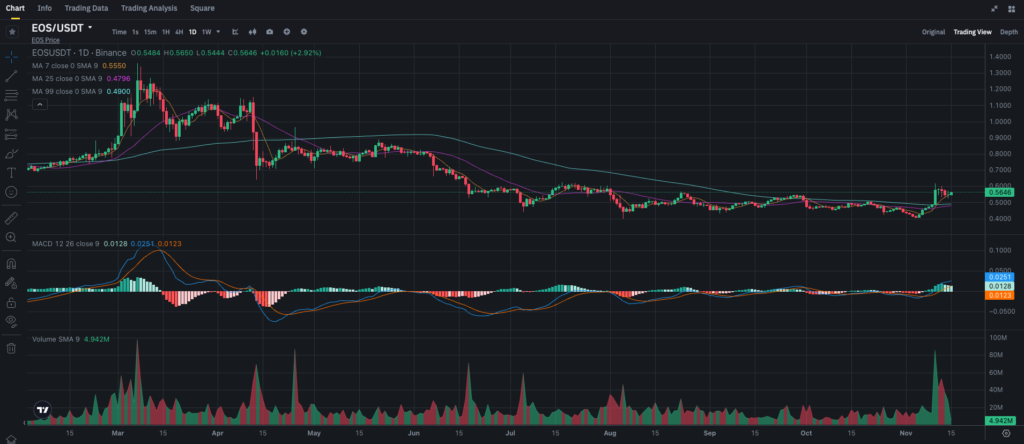
EOS is currently trading near a significant resistance level, with several critical support zones below. Monitoring these levels will be essential for understanding potential price movements.
Resistance Levels
• $0.60 – The recent high, acting as an immediate resistance. If EOS can break above this level, it may encourage additional buying and lead to further gains.
• $0.70 – This level represents a longer-term resistance from previous highs. A break above $0.70 would signal a more substantial shift towards bullish sentiment.
Support Levels
• $0.50 – Acting as a short-term support level, $0.50 could provide stability if EOS experiences a pullback.
• $0.45 – The next major support, which held during previous corrections. A break below this level could indicate a return to bearish pressure.
Moving Averages Analysis
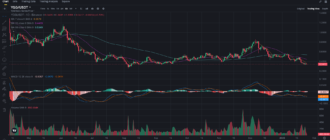
The chart shows the 7-day, 25-day, and 99-day moving averages, giving insights into EOS’s short-, medium-, and long-term trends:
• 7-day MA (purple) at $0.55 – EOS is currently trading above this short-term moving average, indicating some recent bullish strength.
• 25-day MA (green) at $0.48 – With EOS above the 25-day MA, it suggests that a medium-term uptrend may be emerging.
• 99-day MA (blue) at $0.49 – The price has recently crossed the 99-day moving average, which could signify a shift in long-term sentiment if EOS maintains this level.
The positioning of the 7-day and 25-day MAs above the 99-day MA hints at a potential bullish crossover. However, the price needs to stay above these levels to confirm a sustained trend shift.
MACD Signals
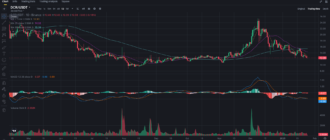
The MACD (Moving Average Convergence Divergence) indicator is showing some signs of bullish momentum:
• The MACD line is above the signal line, a classic indication of upward momentum.
• The MACD histogram is in positive territory, suggesting that the buying interest is currently stronger than the selling pressure.
Although the MACD line is only slightly above the signal line, any increase in the gap between the two lines could indicate that the bullish momentum is gaining strength. Traders should watch for further divergence between the MACD and signal line as an early indicator of stronger buying interest.
Volume Analysis
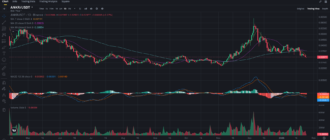
The recent price increase was accompanied by a significant spike in volume, which suggests genuine market interest. This volume increase aligns with the recent upward move, supporting the case for continued momentum. However, the volume has slightly decreased after the initial spike, indicating that the rally may be losing strength.
For EOS to maintain its upward momentum, it will be essential to see sustained or increasing trading volume, particularly if it attempts to break above the $0.60 resistance level. Low volume during an upward movement often indicates weaker support for higher prices, which can result in price reversals.
Recent News and Market Factors Affecting EOS
EOS has seen a series of developments that may influence its price action:
1. Ecosystem Growth and dApp Development – EOS has continued to build out its ecosystem, focusing on decentralized applications (dApps) and improving its blockchain infrastructure. This progress may attract more developers and users to the platform, increasing its value proposition.
2. Community Initiatives and Governance Improvements – EOS recently implemented governance updates to enhance decision-making transparency. Improved governance often builds investor confidence, as it suggests a stable and community-driven project.
3. Broader Market Sentiment – EOS’s recent performance coincides with a positive shift in altcoin sentiment. If this trend continues, it could support EOS’s price as more investors explore alternative cryptocurrencies.
Price Forecast and Scenarios
Bullish Scenario
If EOS can maintain its current momentum above $0.50 and break above $0.60, it may trigger a more sustained rally. A breakout past $0.60 could attract additional buying interest, pushing the price towards the next target of $0.70.
Factors supporting the bullish scenario:
• MACD line continuing to diverge positively from the signal line.
• Increased or sustained trading volume, especially during upward moves.
In this bullish case, EOS could rally to $0.70 or potentially higher if market conditions and volume remain favorable.
Bearish Scenario
If EOS fails to break above $0.60 and instead falls below $0.50, it could signal a return to bearish sentiment. A drop below $0.50 may lead to further declines towards the $0.45 support.
Factors supporting the bearish scenario:
• Declining volume during upward moves, suggesting weakening interest.
• A bearish MACD crossover, where the MACD line falls below the signal line, signaling potential selling pressure.
In the event of a bearish scenario, EOS could retrace to $0.45 or even lower if broader market sentiment turns negative.
Trading and Investment Strategies
Short-Term Trading
Short-term traders may look to capitalize on a breakout above $0.60. A position opened above this resistance level could target $0.70 as the next price point, with a stop-loss placed below $0.55 to manage risk. Conversely, if EOS fails to hold above $0.50, traders might consider shorting with a target at $0.45.
Long-Term Investing
For long-term investors, the recent price increase and ecosystem developments could make EOS an appealing investment. Accumulating positions around the $0.50 level could offer a favorable entry point, especially if EOS maintains this level as support.
Alternatively, investors could wait for a confirmed breakout above $0.60 before committing, which would signal stronger market confidence.
Final Thoughts
EOS is currently in a consolidation phase with potential for upward movement if it can break above key resistance levels. While technical indicators such as the MACD and moving averages hint at bullish sentiment, sustained volume and support at critical levels are needed to confirm a trend reversal.
EOS is available for trading against USDT on Binance.


