Analyzing the Price Chart of ENA
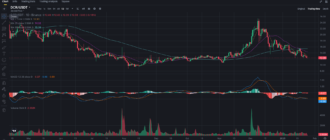
The provided ENA chart (1-day time frame) shows the price movements over the past several months, along with key indicators like moving averages (7-day, 25-day, and 99-day) and the MACD (Moving Average Convergence Divergence). Let’s break down these indicators and what they suggest for ENA’s price action and potential future trends.
Price Action Overview
Over the past several months, ENA has experienced significant volatility, with a prominent rally earlier in the year, followed by a gradual downtrend. More recently, the chart indicates a period of consolidation, and in the past weeks, we see signs of a possible trend reversal.
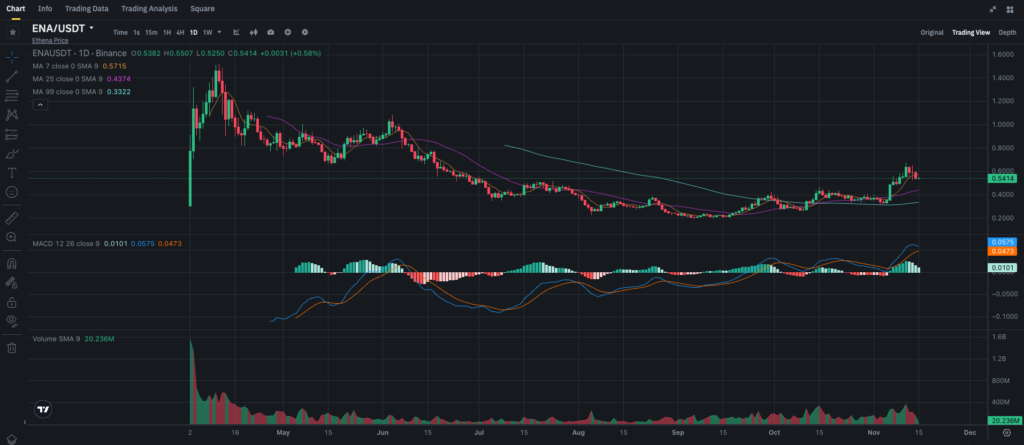
Currently, ENA’s price is trading around $0.54, with recent upward movements that broke through key moving averages, indicating a short-term bullish momentum. However, the retracement following the recent peak suggests that sellers might still be present, balancing the optimism with caution.
Key Support and Resistance Levels
Identifying major support and resistance levels is crucial in evaluating ENA’s potential price movements.
- Immediate Support: $0.50 – This psychological level is near the current price. Holding above this level is critical for sustaining the recent bullish momentum.
- Key Support: $0.33 – This level aligns closely with the 99-day moving average, serving as a robust support zone that has been tested in the past.
- Resistance Level: $0.60 – This is a notable resistance where ENA recently faced rejection, suggesting it’s a crucial hurdle for any further upward movement.
- Major Resistance: $0.80 – The next significant barrier for ENA, which if broken, could signal a strong upward rally.
With these levels mapped out, let’s examine how the technical indicators add to this picture.
Moving Averages (MA) Analysis
Moving averages provide insights into the general trend and momentum of ENA.
- 7-day MA (Short-Term): Currently at $0.57, this moving average sits above the price, indicating that short-term traders may be more inclined to take profits, causing some selling pressure. However, a breakout above the 7-day MA would likely renew short-term buying interest.
- 25-day MA (Medium-Term): Positioned at $0.44, the 25-day MA is below the current price, showing that the recent upward trend has support from a medium-term perspective. This level may serve as a support line if the price continues to consolidate.
- 99-day MA (Long-Term): Located at $0.33, this long-term average provides the strongest support level. ENA’s recent price movements above this line mark a significant change in trend, which could attract long-term investors if it continues to hold.
The recent crossover above the 25-day and 99-day MAs suggests that ENA has shifted into a bullish phase on the daily chart. However, the inability to sustain above the 7-day MA signals a need for caution, as the trend might not yet be fully established.
MACD Analysis
The MACD indicator adds depth to our analysis, helping to confirm or question the trend indicated by the price action and moving averages.
- MACD Line: Currently above the Signal Line, which is a bullish indicator. This suggests that the positive momentum has not yet been fully exhausted, although the recent histogram bars show a declining trend, indicating a potential slowing down of buying pressure.
- Histogram: The histogram shows a recent decrease in momentum after the latest rally, which corresponds with the price retracement from the $0.60 level. This is a potential early signal of a trend reversal or at least a pause in upward momentum.
If the MACD crosses below the Signal Line in the coming days, it could signal the beginning of a new downtrend, making the $0.50 support level even more critical. However, if the MACD line manages to stay above the Signal Line, ENA may have a chance to resume its upward path, especially if external market factors remain supportive.
External Factors Impacting ENA’s Price
Recent News and Developments
In the cryptocurrency market, news events can trigger significant price swings, especially for coins like ENA, which may be influenced by technological developments, partnerships, or general market sentiment. Here are some recent trends and events that could impact ENA:
- Market Sentiment on Altcoins: The broader crypto market, especially in the altcoin sector, has shown signs of renewed interest following periods of low volatility. Positive sentiment towards altcoins in general could contribute to buying pressure on ENA.
- New Project Updates: If ENA’s team has released updates or upcoming developments, such as improvements in the network, partnerships, or DeFi integrations, this could positively influence the coin’s appeal to investors. As ENA gains attention, these developments may push demand higher.
- Macro Economic Factors: Global macroeconomic conditions, including inflation data, central bank policies, and overall risk sentiment, continue to shape the crypto market. With potential regulatory clarity on digital assets, any favorable news could enhance ENA’s appeal as a promising investment.
Trends in Trading Volume and Liquidity
ENA’s trading volume, as displayed on the chart, has shown moderate fluctuations. A noticeable increase in volume occurred during the recent rally, indicating genuine buying interest, but subsequent lower volumes suggest that the enthusiasm might not yet be broad-based.
If volume picks up again, especially on any breakout above $0.60, this could signify renewed interest and possibly mark the start of a more substantial rally. Conversely, declining volume could indicate a lack of conviction from buyers, setting up a potential pullback.
Price Forecast and Scenarios for ENA
Given the above analysis, ENA’s future price action can unfold in several potential scenarios:
- Bullish Scenario: If ENA manages to break above the $0.60 resistance with increased volume, it could trigger a fresh round of buying interest, potentially pushing the price toward the next major resistance at $0.80. A confirmed bullish trend might even target $1.00, though this would likely require supportive market conditions and continuous positive sentiment.
- Neutral/Consolidation Scenario: If ENA stays in the range between $0.50 and $0.60 without a strong breakout, it could be forming a consolidation pattern. In this case, traders might wait for a decisive move in either direction before taking significant positions. Such consolidation could indicate that the market is building momentum for a future breakout.
- Bearish Scenario: If the price fails to hold the $0.50 support level and continues downward, especially with a bearish MACD crossover, ENA may revisit the $0.33 level (99-day MA). This would be a crucial test, as a drop below this point could signal a prolonged bearish phase.
Trading and Investment Recommendations
For Short-Term Traders
Traders could consider opening a position if ENA confirms support above $0.50 and shows signs of renewed momentum. A stop-loss slightly below $0.50 would manage risk in case of a bearish reversal. If ENA breaks above $0.60, short-term traders could target $0.70 to $0.80 as potential exit points.
If ENA remains below $0.60 and trading volume declines, a wait-and-see approach might be prudent to avoid potential losses from a trend reversal.
For Long-Term Investors
Long-term investors might consider accumulating ENA if it holds above the 99-day MA at $0.33, indicating that the long-term trend remains intact. Dips towards $0.33 or lower could present favorable buying opportunities for those with a higher risk tolerance and a multi-month investment horizon. Alternatively, if ENA breaks above $0.80, it could be a signal of a more significant trend shift, encouraging further accumulation.
Conclusion
ENA is currently at a pivotal stage, with technical indicators showing both short-term bullish potential and some cautionary signals. With the $0.50 support and $0.60 resistance levels in focus, traders and investors can anticipate potential buying or selling points based on these critical thresholds. The broader market trends and specific developments within the ENA ecosystem will play essential roles in shaping its future price action.
ENA is available for trading on Binance in a USDT pairing, which provides liquidity and accessibility for those looking to engage in this market. Binance

