DogeWharf (WIF) Price Analysis: Key Levels and Market Trends
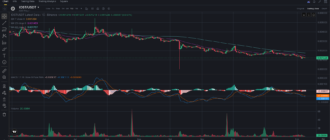
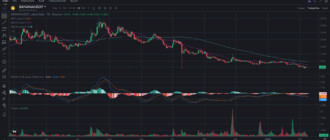
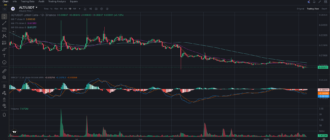
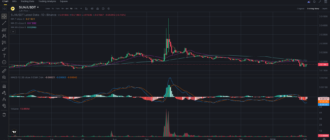
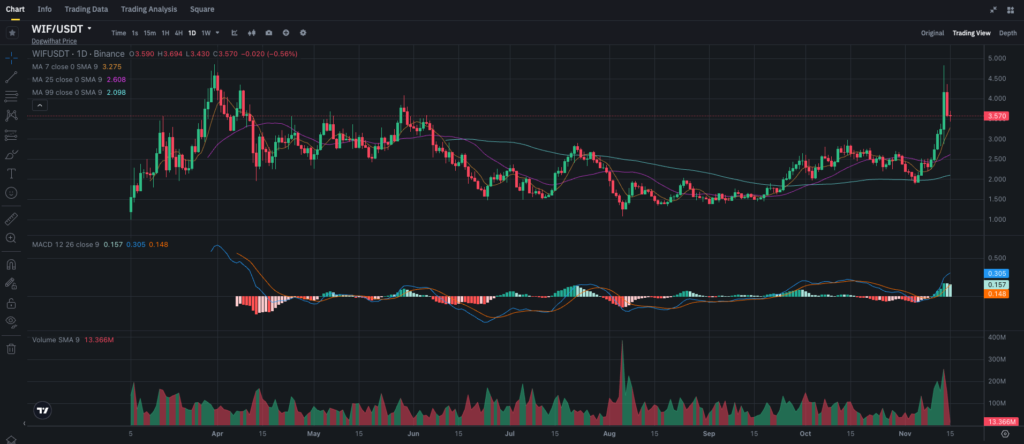
DogeWharf (WIF) has recently seen a surge in price, jumping from $2.5 to a peak around $4.5 before retracing to $3.57. This sharp price movement signals strong interest but also significant volatility, creating both opportunities and risks. Below is an in-depth analysis of support and resistance levels, key indicators, and recent events that could impact WIF’s price in the near term.
Key Support and Resistance Levels
DogeWharf is currently in a high-volatility phase. Here are the crucial levels to watch:
Resistance Levels
• $4.0 to $4.5 – The recent peak area, now acting as resistance. Breaking above $4.5 could attract more buyers and drive further price increases.
• $5.0 – This round number is a psychological resistance level and could pose a challenge if WIF continues upward.
Support Levels
• $3.0 – Acting as near-term support. Holding above this level could set the stage for another rally.
• $2.5 – This is a major support level. A move below $2.5 could indicate a potential trend reversal.
Moving Averages Analysis
Three moving averages on the daily chart provide insight into WIF’s trend:
• 7-day MA (purple) at $3.28 – Currently above the 25-day MA, signaling short-term bullish momentum.
• 25-day MA (green) at $2.60 – The price is above this MA, indicating medium-term strength.
• 99-day MA (blue) at $2.10 – A long-term bullish indicator, as the price remains significantly above this level.
The bullish crossover between the 7-day and 25-day MAs suggests continued short-term upward momentum. However, the large gap between the current price and the 99-day MA might signal overextension, increasing the likelihood of a correction or consolidation.
MACD Signals
The MACD (Moving Average Convergence Divergence) is showing strong bullish momentum:
• The MACD line is well above the signal line, signaling continued buying pressure.
• The expanding MACD histogram in positive territory indicates sustained bullish interest.
However, the wide gap between the MACD and signal lines could indicate overbought conditions. If the MACD starts to converge back toward the signal line, this might signal a cooling-off period or a potential retracement.
Volume Analysis
During the recent price spike, trading volume surged, showing strong market interest. As WIF pulled back, volume decreased, suggesting that the correction lacks significant selling pressure. This decline in volume during a pullback can be a positive sign, as it indicates that buyers remain interested.
If volume rises again during an upward move, it could support further gains. Conversely, continued low volume might signal waning interest, potentially leading to consolidation or a further retracement.
Recent News and Events Influencing DogeWharf
Several developments may be affecting DogeWharf’s price momentum:
1. Social Media Attention – DogeWharf has recently gained traction on social media, with a growing community rallying behind the token. Increased attention can drive short-term price gains as new investors enter the market.
2. Partnerships and Ecosystem Growth – DogeWharf has recently formed partnerships within the DeFi space, potentially increasing its utility and appeal.
3. Overall Market Sentiment – DogeWharf’s rally comes amid a broader positive trend in the altcoin market. If the general crypto market sentiment remains bullish, WIF could continue to benefit.
Price Forecast and Scenarios
Bullish Scenario
If DogeWharf holds above the $3.0 support level and breaks through the $4.5 resistance, it could maintain its upward trend. A break above $4.5 would likely attract more buyers, pushing the price toward $5.0.
Factors favoring this scenario include:
• Positive MACD divergence and widening histogram.
• Increased trading volume during rallies.
If WIF breaks above $4.5 with high volume, potential targets could be $5.0 to $5.5.
Bearish Scenario
If WIF fails to hold above $3.0, a pullback to the $2.5 support level may occur. This scenario might unfold if MACD momentum weakens or selling pressure increases.
Factors favoring this scenario include:
• Declining volume during upward moves, indicating weakening demand.
• A potential MACD bearish crossover, signaling a trend reversal.
If DogeWharf falls below $3.0 with increased selling volume, it could continue down to the $2.0 to $2.5 range.
Trading and Investment Strategies
Short-Term Trading
Short-term traders may look for a breakout above $4.0 to capitalize on a potential move toward $4.5. If the price fails to break above $4.5, traders could consider exiting positions, with stops set below $3.5 to manage risk. Alternatively, if WIF drops below $3.0, shorting could be an option, targeting the $2.5 support level.
Long-Term Investing
Long-term investors might consider accumulating WIF at or below $3.0, especially if it stabilizes around $2.5. Averaging down at these levels could reduce entry cost, positioning for potential gains if WIF’s long-term fundamentals remain strong.
Alternatively, waiting for a break above $4.5 could signal stronger support and long-term upside potential.
Final Thoughts
DogeWharf’s recent surge and subsequent correction demonstrate the high level of interest and volatility surrounding the token. With a bullish setup but overbought signals on some indicators, traders and investors should watch the $3.0 support and $4.5 resistance closely. If WIF holds key levels, it could see another rally; otherwise, a pullback to $2.5 remains possible.
DogeWharf is available for trading against USDT on Binance.

