
The Cosmos ecosystem, powered by its native token ATOM, is designed to address one of the most pressing challenges in blockchain technology—interoperability. Known as the “Internet of Blockchains,” Cosmos facilitates seamless communication between different blockchains. Over the years, ATOM has experienced significant price swings. From its all-time high near $44 in 2021 to its corrective phase, the coin has seen fluctuating investor interest. Now, as 2024 unfolds, we analyze ATOM’s price chart and technical indicators to project its potential trajectory for 2025.
Technical Analysis of ATOM’s Price Chart
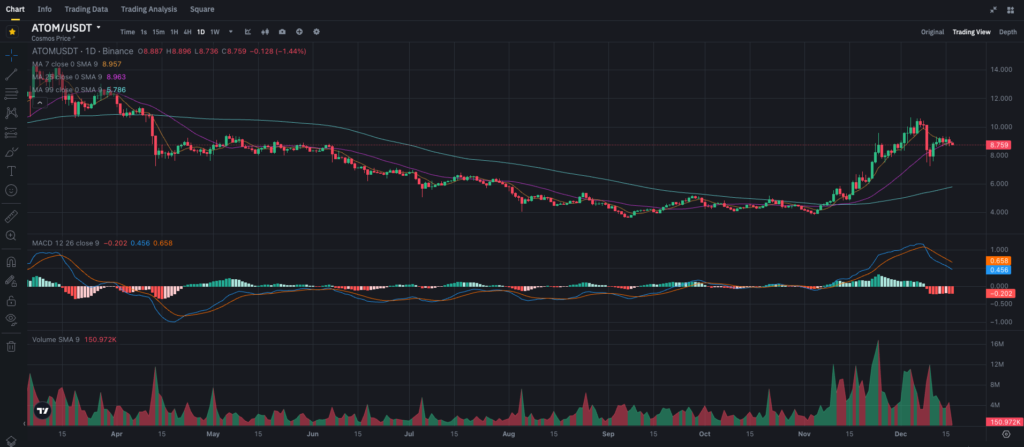
The daily chart for ATOM (ATOM/USDT pair) reveals key trends and signals that help determine the price direction. Here’s a closer look at current levels, indicators, and patterns:
Support and Resistance Levels
Currently trading around $8.75, ATOM has seen a pullback from its recent rally where it touched the $10 resistance level.
- Support: The first major support lies around $8, followed by a stronger level near $7.50, where the 99-day moving average (MA 99) provides additional strength.
- Resistance: On the upside, $10 remains the critical short-term resistance. A decisive break above could pave the way for a test of the next major resistance near $12.
Moving Averages
The 7-day MA (short-term) is currently hovering around $8.95, while the 99-day MA is at $7.78. The following signals emerge:
- The price remains above the 99-day MA, signaling mid-term bullishness.
- However, the recent drop below the 7-day MA suggests short-term bearish sentiment, signaling that the price could test lower support before rebounding.
MACD (Moving Average Convergence Divergence)
The MACD lines indicate a bearish divergence:
- The MACD line (blue) has crossed below the signal line (orange), showing a downward trend.
- The histogram is red, further confirming the selling momentum.
This suggests that the market may undergo consolidation or a slight retracement before any new upward move.
Volume and Trend
Trading volumes have significantly increased during November’s rally, signaling strong buying pressure. However, as we approach mid-December, volumes have declined, indicating some indecision among market participants. If the volume picks up near support zones, ATOM could witness a renewed bullish wave.
Price Forecast for 2025
Analyzing ATOM’s price movement and technical indicators, we outline the potential trajectory for 2025 under a realistic market scenario.
Bullish Scenario
If ATOM holds the $7.50–$8 support range and breaks above the $10–$12 resistance zone, it could trigger a strong uptrend. Given the technical structure and Cosmos’s growing adoption in the blockchain space, ATOM has the potential to revisit its 2021 highs near $40–$45 by the end of 2025.
Neutral Scenario
Should the market remain range-bound, ATOM may trade between $8 and $12 for a prolonged period. This would depend on overall market sentiment and Cosmos’s ability to attract new projects into its ecosystem.
Bearish Scenario
A breakdown below the critical $7.50 support level could push the price down to $6 or even lower. However, given the recent signs of recovery, this remains a less likely scenario unless significant bearish catalysts emerge.
Key Factors That Could Influence ATOM’s Price
Adoption of the Cosmos Ecosystem
Cosmos’s ability to solve interoperability issues through its IBC (Inter-Blockchain Communication) protocol has made it a go-to solution for projects requiring chain-to-chain connectivity. Any major announcements or integrations in 2024 could significantly boost demand for ATOM.
Market Sentiment
The broader cryptocurrency market plays a crucial role in ATOM’s price. A sustained recovery in Bitcoin and Ethereum often translates into capital inflow into altcoins like ATOM.
Technological Upgrades
Cosmos developers are continually enhancing its infrastructure. Upcoming upgrades to improve transaction speeds, lower fees, or implement new features could attract more users and projects.
Regulation and Macro Trends
Global regulations, investor sentiment, and macroeconomic conditions (e.g., inflation rates, interest rate policies) will also affect ATOM’s performance in the coming years.
Partnerships and Integrations
Collaborations with major players in DeFi, NFTs, and other blockchain verticals could position Cosmos as a leading Layer-1 ecosystem.
Possible Actions for Traders and Investors
Given the current price action and technical indicators, here’s how traders and investors could navigate ATOM:
For Short-Term Traders
Short-term traders may look for buying opportunities around the $7.50–$8 support zone. A bounce from this area with rising volumes could signal a potential long entry targeting the $10–$12 resistance. On the other hand, traders should monitor stop-loss levels closely in case of further declines.
For Long-Term Investors
Long-term investors could consider accumulating ATOM during dips, especially around the $7.50 level. If Cosmos continues to see adoption and upgrades in 2024, ATOM’s price could experience exponential growth by 2025. For those already holding ATOM, partial profit-taking around $12 might be a sensible move to manage risk.
Final Thoughts
ATOM remains a promising token in the blockchain industry, thanks to Cosmos’s groundbreaking approach to solving blockchain interoperability. Despite short-term volatility, the technical indicators show signs of a potential upward movement, especially if critical support levels hold. For 2025, the price could range between $12–$45, depending on adoption, technical upgrades, and broader market conditions.
ATOM is available for trading on leading exchanges, including Binance, Bybit, and HTX.


