Understanding the Current Market Structure
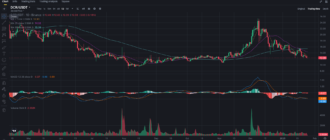
The Civic (CVC) price chart displayed is on a 4-hour timeframe, and we observe a notable pattern of price movements along with relevant indicators such as moving averages and the MACD (Moving Average Convergence Divergence). The chart reveals that the CVC price has experienced a volatile journey, with a significant price surge followed by a period of retracement and consolidation.
At the time of the chart capture, the price of CVC is around 0.1416. Let’s break down the market structure and interpret the technical signals in detail to provide a comprehensive outlook for both short-term traders and long-term investors.
Price Action and Moving Averages
From the chart, we can identify that the CVC price had a significant rally, reaching above 0.25 before sharply retracing. The moving averages (MA) plotted include the 7-period, 25-period, and 99-period MAs, which serve as indicators of momentum and support/resistance levels.
1. Short-Term Moving Average (7 MA): The 7-period moving average is closely tracking the price, indicating that it is a good short-term indicator for support and resistance. Recently, the price has moved above this MA, which is an early bullish sign for short-term traders, suggesting that there could be an attempt to retest higher resistance levels.
2. Medium-Term Moving Average (25 MA): The 25-period MA is currently positioned below the 7-period MA, supporting the bullish crossover. The price staying above the 25 MA indicates that the bullish momentum might have room to continue in the short term, especially if trading volume increases.
3. Long-Term Moving Average (99 MA): The 99-period moving average, which represents a broader trend, is above the current price level at around 0.1423. This level could act as a resistance barrier if the price attempts to break higher. A successful break above this MA could potentially open the way for further upside movement, establishing a more substantial bullish trend.
Volume Analysis
Volume is a critical factor in determining the strength of a price move. The chart shows a notable increase in trading volume during the recent rally, confirming that the upward movement was supported by strong buying activity. However, after the peak, the volume subsided, which corresponded with the retracement phase.
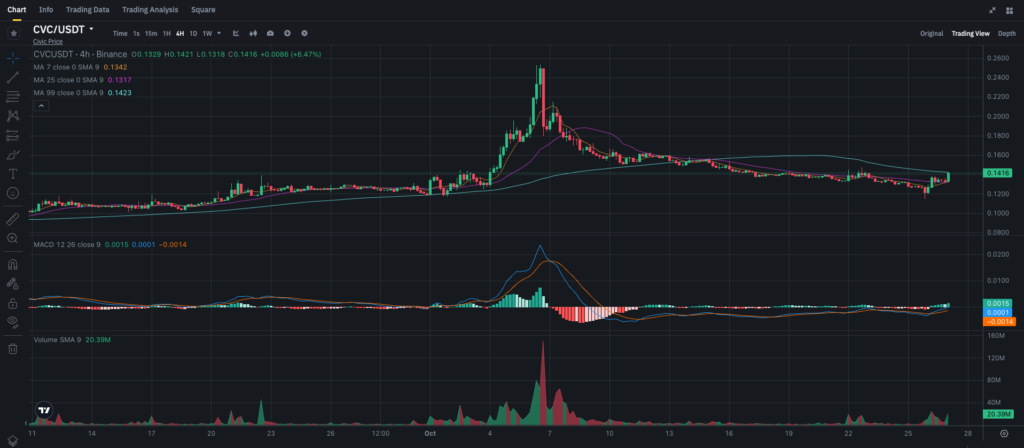
Currently, the trading volume is relatively moderate, suggesting that the market participants are indecisive, waiting for a catalyst or confirmation before making significant moves. For a sustained bullish trend, we need to see a renewed increase in volume as the price approaches key resistance levels.
MACD Analysis
The MACD indicator is another valuable tool for understanding momentum and trend reversals.
• MACD Line and Signal Line: The MACD line (blue) recently crossed above the signal line (orange), creating a bullish crossover. This is often a signal for a potential upward price movement. If the MACD maintains its position above the signal line, this could indicate that momentum is gaining in favor of the bulls.
• Histogram: The MACD histogram is currently showing green bars, albeit small, which aligns with the recent upward price movement. A continuation of the green histogram bars could be a sign of strengthening momentum. However, traders should be cautious if the bars start to shrink or turn red, as this could indicate a weakening trend.
Support and Resistance Levels
Identifying support and resistance levels is crucial for planning trades and understanding potential market reactions:
• Immediate Resistance: The first significant resistance level lies around 0.1423, which corresponds to the 99-period moving average. A breakout above this point could push the price toward the next resistance level around 0.16.
• Major Resistance: Beyond 0.16, the next major level would be the previous peak above 0.25. However, it would require strong bullish momentum and a high trading volume to reach this level.
• Immediate Support: The nearest support level can be seen around 0.13, which aligns with the 25-period moving average. If the price falls below this, the next key support zone would be around 0.12, a previous consolidation area that could act as a floor for the price.
What Should Traders and Long-term Investors Do?
For traders and investors, understanding the implications of the current market signals is essential:
Traders
Short-term traders may find the recent bullish crossover on the MACD and the price movement above the 7-period moving average as an opportunity for long entries. However, caution is advised around the 99-period MA resistance at 0.1423. If the price breaks above this level with a spike in volume, traders can target the 0.16 resistance area for a potential exit.
On the downside, if the price rejects from the 99-period MA and breaks below the 25-period MA at 0.13, traders might want to place stop-loss orders to minimize potential losses. Monitoring the MACD for signs of divergence or a bearish crossover will be crucial in timing exits.
Long-term Investors
For long-term investors, the recent price action indicates a consolidation phase following a significant rally. This is often a period of accumulation for those who believe in the long-term potential of the Civic project.
If the price manages to stay above the 0.12 support zone, it could present a strategic entry point for accumulating more CVC tokens, aiming for higher price levels in the coming months as the broader market conditions improve. However, if the price breaks down below 0.12, it could lead to further downside, and investors may want to wait for a new level of consolidation before entering.
Price Prediction: What’s Next for Civic?
Based on the technical indicators and chart patterns, CVC shows potential for a short-term upward movement, provided the price breaks above the 99-period moving average.
1. Short-Term Forecast: In the short term, if the price breaches the 0.1423 resistance level with strong volume, we could see a rally toward 0.16. A failure to break above this level could lead to a retest of the 0.13 and 0.12 support levels.
2. Medium to Long-Term Forecast: If CVC remains above the key support zones and the broader crypto market sentiment improves, the price could attempt to retest the 0.25 high in the coming months. However, this will require increased market participation and positive news regarding Civic’s development or partnerships.
Investors should also keep an eye on the overall crypto market sentiment and external factors that could influence prices, such as regulatory news or developments from Civic itself.
Conclusion
CVC’s recent price action suggests a consolidation phase with potential bullish momentum building up. Traders should watch for breakouts above the 0.1423 level for short-term gains, while long-term investors might consider accumulating at the current support levels. However, risk management remains crucial as the market can quickly turn.
For more insights and detailed analysis, subscribe to my blog on Binance Square: Subscribe Now. Share your thoughts, ask questions, and stay updated with the latest cryptocurrency trends and forecasts!

