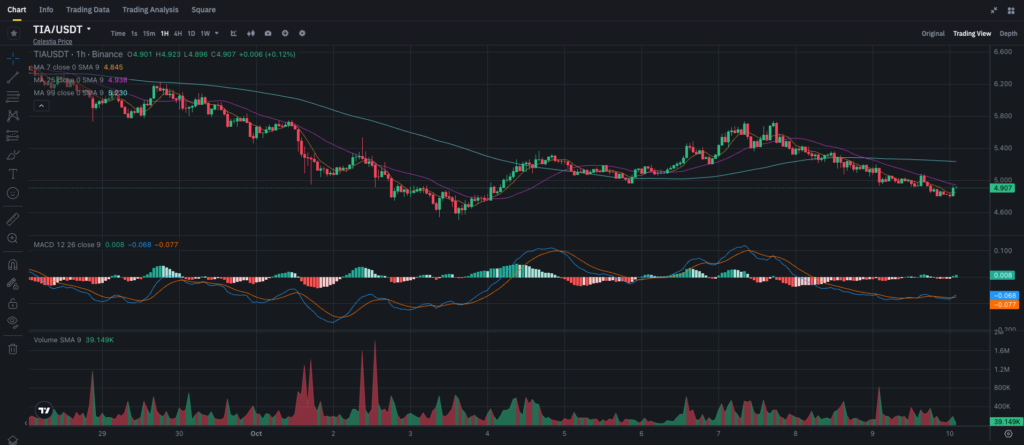
Celestia (TIA) has experienced a notable decline over the past several days, dropping from a recent high of $5.60 to below the $5.00 mark. This sharp drop has left traders wondering if the current levels offer a good entry point or if further declines are likely. Let’s break down the technical indicators and chart patterns to understand the most likely scenarios and provide actionable insights for both traders and long-term investors.
Key Support and Resistance Levels
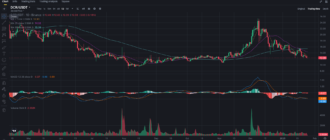
Identifying the major support and resistance levels can help traders plan their next moves. The chart shows several important levels to watch closely.
Support Levels:
- $4.90: This is the immediate support level TIA is currently testing. A failure to hold this level could see TIA testing lower price points around $4.70.
- $4.70: A strong psychological support level. If the price drops below this, it could open the doors to further downside.
Resistance Levels:
- $5.00: The price will need to break above this psychological level to confirm any recovery. It has been tested multiple times but hasn’t seen sustained upward movement yet.
- $5.23: The 99-period SMA sits around this price point, which is a crucial long-term resistance level. Breaking this would suggest a shift in momentum to the upside.
Moving Averages: Bearish Signals Dominate
A quick look at the moving averages indicates that TIA remains in a bearish phase for the time being.
- The 7-period SMA is currently at $4.85, and the price is fluctuating slightly above it. This short-term moving average has acted as a support level, but TIA needs a move above the 25-period SMA at $4.93 to signal potential recovery.
- The 99-period SMA, resting at $5.23, represents a major resistance zone. A breakout above this would indicate a shift to a more bullish trend, but until then, the trend remains downward.
This combination of short and long-term moving averages points to a market that’s still uncertain, with more bearish than bullish sentiment.
MACD: Signs of Potential Reversal?
The MACD (Moving Average Convergence Divergence) indicator offers some hope for traders looking for a reversal in TIA’s downward trend.
- The MACD line is at 0.008, slightly above the signal line, which sits at -0.068. This shows a subtle divergence between the two, signaling that the downward momentum could be fading.
- The MACD histogram is starting to show weakening bearish pressure, indicating that selling may be slowing down. This could lead to a possible reversal if the bullish divergence continues.
However, traders should wait for stronger confirmation from the MACD, as it hasn’t fully crossed into bullish territory yet.
Volume: Low Activity Suggests Weak Market Interest
One of the factors contributing to TIA’s inability to recover significantly is the lack of substantial volume. The Volume SMA (9) sits at 39.149K, which is relatively low, suggesting that both buyers and sellers are not showing strong interest at the current price levels.
Without increased trading volume, TIA may struggle to push through the resistance levels mentioned above, especially around $5.23.
Market Sentiment and Recent Trends
Celestia is a promising project in the blockchain space, with its innovative approach to modular blockchains. However, much like the broader market, it’s been affected by general market downturns and macroeconomic pressures, including regulatory uncertainty and declining crypto sentiment across the board.
Recently, there hasn’t been any major news specific to Celestia that would serve as a price catalyst, meaning that TIA is largely moving in sync with broader market trends. Any positive market shift or Celestia-related developments could spark a recovery, but for now, external market factors are dominating price action.
Trading and Investment Strategies
For Short-term Traders:
- Range Trading: Given the current range between $4.90 and $5.23, traders might consider buying near the support levels and targeting the $5.00 mark for short-term gains. A tight stop-loss below $4.85 could help mitigate risks.
- Breakout Trading: If TIA breaks convincingly above the $5.23 resistance level, traders could enter long positions, aiming for higher levels around $5.50 or even $5.80. Watch for volume confirmation before entering this trade.
For Long-term Investors:
- Accumulation Strategy: Long-term investors who believe in the fundamentals of Celestia may view the current price levels as a good opportunity to accumulate. The $4.70 and $4.90 levels offer decent entry points, especially for those with a long-term horizon.
- Hold Strategy: If you already hold TIA, it’s wise to watch for a confirmed breakout above $5.23 before making any moves. A solid recovery above this level would suggest a more bullish trend and might justify holding onto positions.
Conclusion: Is TIA Due for a Recovery?
TIA is currently at a critical support level near $4.90. While the MACD shows some signs of a potential reversal, the overall market structure remains bearish. For TIA to recover, it will need to clear the $5.00 psychological barrier, followed by the $5.23 resistance level, with stronger volume to back the move.
For short-term traders, the range between $4.90 and $5.23 offers opportunities for quick trades, while long-term investors may find these levels attractive for accumulation, provided they believe in Celestia’s long-term potential.
To stay updated with more technical analysis and insights, follow my blog on Binance Square, and don’t forget to join my Telegram channel for real-time updates and discussions.

