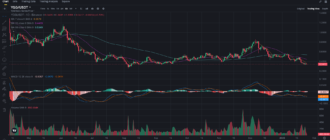
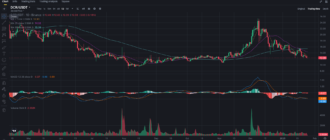
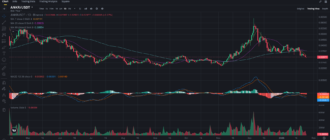
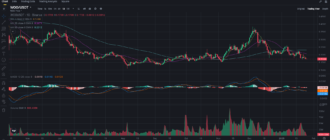
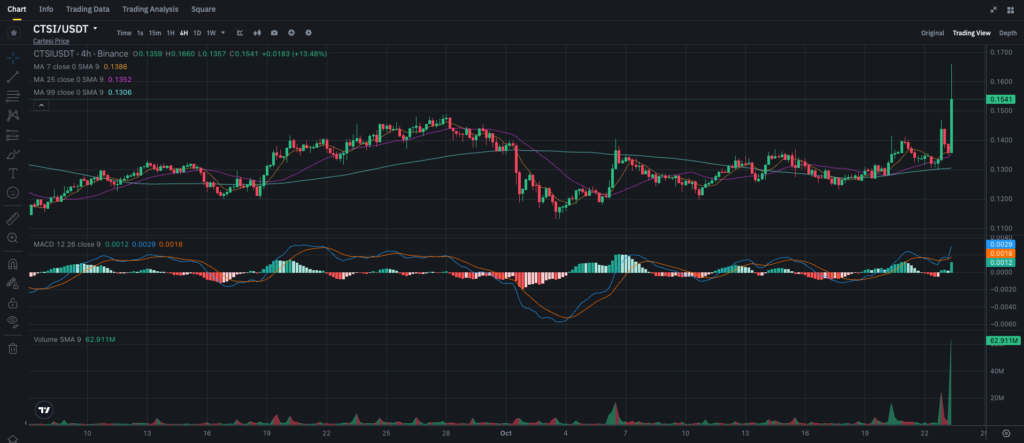
Cartesi (CTSI) has just made a significant breakout, catching the attention of traders. With a sharp 13.48% jump in price, CTSI has moved past key resistance levels, creating an exciting opportunity for traders looking to capitalize on its momentum. Let’s dive into the 4-hour chart and explore the key indicators, support and resistance levels, and what traders should be looking for next.
CTSI’s Recent Surge: What’s Driving the Price?
At the time of writing, CTSI is trading at $0.1541, having broken through multiple resistance levels. The 4-hour chart shows a sharp spike in volume, confirming that buyers have stepped in aggressively. This surge could be attributed to several factors:
• Positive Market Sentiment: CTSI’s recent price action aligns with an overall positive sentiment in the altcoin market, driven by speculation and new project developments.
• Technical Breakout: After trading sideways between $0.13 and $0.14 for a while, the breakout past $0.15 likely triggered stop orders, leading to increased buying pressure.
• Upcoming Updates: While no major news directly tied to CTSI has surfaced in the past 24 hours, many traders are speculating that upcoming project announcements could be influencing this recent price spike.
Technical Analysis: Bullish Breakout Confirmed
Moving Averages: Bullish Signals All Around
The chart shows that CTSI is comfortably trading above all key moving averages. Specifically:
• 7-period SMA: Currently at $0.1386, it has sharply turned upwards, indicating a strong short-term bullish trend.
• 25-period SMA: At $0.1362, it has also tilted upward, reinforcing the momentum.
• 99-period SMA: Sitting at $0.1306, this long-term moving average was breached by the price during the breakout, signaling a potential long-term trend reversal.
MACD: Bullish Crossover Confirmed
The MACD (Moving Average Convergence Divergence) shows a clear bullish signal. Both the MACD line and the signal line have crossed into positive territory, with the MACD reading at 0.0018, and the histogram expanding, which suggests growing bullish momentum. The momentum indicator confirms that this breakout is well-supported by increased buying interest, which could propel the price further upward.
Key Support and Resistance Levels to Watch
Support Levels:
• $0.15: The price has just broken through this level, but it remains crucial. If CTSI dips, $0.15 will be the first area traders should watch to see if buyers step back in.
• $0.14: This was a previous resistance zone before the breakout and now serves as support. A drop below this level might indicate a failed breakout.
Resistance Levels:
• $0.16: The first key resistance to watch after the breakout. If bulls manage to push past this, CTSI could enter another rally.
• $0.17: A significant level to watch, as it represents a previous high. Breaking through this could trigger a move toward $0.20.
Volume Surge: A Key Indicator of Momentum
The volume spike on the 4-hour chart is one of the most telling indicators supporting the breakout. Over 62.9 million CTSI tokens have changed hands recently, marking one of the highest trading volumes in the past few weeks. This shows that this breakout isn’t just a small push by a few traders but is backed by substantial interest in the token.
Volume is one of the most important indicators to confirm price movements, and this surge suggests that the breakout is genuine and could be followed by further upward price action.
Trading Strategies for CTSI
Short-Term Traders: Watch for a Pullback or a Continuation
For short-term traders, the breakout above $0.15 opens up several opportunities.
• Bullish Strategy: If CTSI continues its momentum, traders could consider entering long positions if the price stays above $0.15 and breaks above $0.16. The target could be set at $0.17, with a stop-loss just below the $0.15 support level to manage risk.
• Bearish Strategy: If the price dips below $0.15, traders could wait for a retest of the $0.14 support level. If this support fails, a short position could be opened with a target of $0.13 and a stop-loss above $0.145.
Long-Term Investors: Consider Accumulating on Dips
For long-term holders, the current breakout offers a potential entry point, but waiting for a slight pullback might offer a better risk-to-reward ratio.
• Accumulation Strategy: Long-term investors could consider buying more CTSI on any dips below $0.15, especially if the price holds above the $0.14 support. The long-term target remains above $0.20 as CTSI continues its upward trend.
• Cautious Approach: Waiting for a clear confirmation that CTSI will hold above $0.15 before accumulating more tokens is also a prudent strategy. The next few days will likely confirm whether this breakout is the start of a larger rally or just a temporary spike.
Price Prediction: Can CTSI Push Higher?
Given the strong technical indicators and the volume backing this breakout, CTSI could very well continue its upward trajectory. However, the strength of the $0.16 resistance will be key to watch. Let’s explore two possible scenarios:
Bullish Scenario:
• If CTSI manages to break above $0.16, it could easily target $0.17 in the next few days. With enough buying pressure and positive market sentiment, CTSI might even push toward $0.20 in the short term.
Bearish Scenario:
• On the other hand, if CTSI struggles to hold above $0.15 and selling pressure increases, the token could retest the $0.14 or even $0.13 support levels. A break below $0.13 would signal a reversal of the current uptrend.
Final Thoughts: A Key Moment for CTSI
Cartesi (CTSI) has shown a powerful breakout, and the next few trading sessions will be critical to confirming whether this is the start of a sustained rally or a short-lived surge. For short-term traders, careful monitoring of support and resistance levels will be essential. For long-term investors, accumulating on dips could provide a solid entry point, especially if the market confirms the bullish trend.
Don’t forget to subscribe to my blog on Binance Square for more in-depth analysis on CTSI and other cryptocurrencies, and join my Telegram channel to stay updated with real-time insights and strategies.


