The world of meme coins is always full of surprises, and BONK is no exception. Known as one of the more quirky and community-driven tokens, BONK has attracted a lot of attention due to its vibrant community and meme culture appeal. However, the token’s price action lately hasn’t been as exciting. BONK is currently struggling to regain momentum after a period of consistent downtrends. So, what’s next for this token? Let’s break down the technical analysis and try to make sense of where BONK might be headed.
BONK Price Overview: Support and Resistance Levels
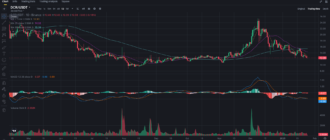
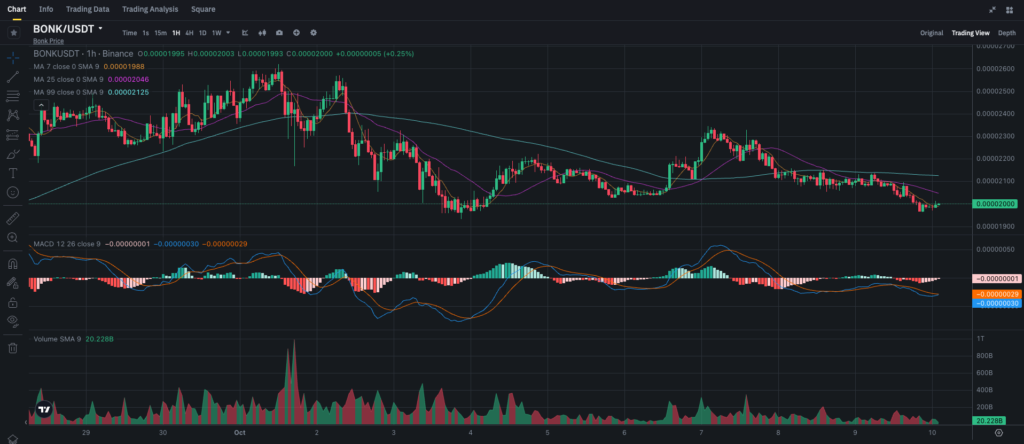
Looking at the chart, BONK is currently trading around 0.00002000. It’s hovering just above a crucial support level, but it has been in a steady downtrend for the past several days. For traders and investors, the question is whether BONK can bounce from this support or continue its bearish decline.
Key Support Levels:
- 0.00001950: This is the immediate support level. If BONK breaks below this, we could see the token plummet further, testing lower support levels around 0.00001800.
- 0.00001800: A critical support area that BONK must hold to prevent a more significant sell-off. A fall below this could lead to increased panic selling and more downside.
Key Resistance Levels:
- 0.00002050: The first key resistance to watch. BONK needs to break above this to regain some bullish momentum.
- 0.00002150: If BONK can push above 0.00002050, the next challenge will be this resistance. A break above could trigger a recovery rally toward 0.00002300.
Moving Averages: Mixed Signals
Moving averages often serve as a good indicator of overall trend direction and strength. In BONK’s case, the moving averages are giving off mixed signals:
- The 7-period SMA is sitting at 0.00001988, just slightly below the current price. This suggests that BONK is fighting to stay above short-term averages, which is a positive sign for the bulls, but it also means the price is barely holding on.
- The 25-period SMA is at 0.00002046, acting as short-term resistance. This indicates that the token is still under some selling pressure.
- The 99-period SMA is positioned at 0.00002125, suggesting that BONK is well below its long-term trend, reinforcing the overall bearish sentiment.
These moving averages confirm that BONK is struggling to find a clear direction and is currently trading in a volatile, bearish environment.
MACD: No Strong Momentum
The MACD (Moving Average Convergence Divergence) indicator is not showing any strong momentum in either direction, which is a bit concerning for traders looking for a clear trend.
- The MACD line and the signal line are both hovering near zero, with the MACD line at -0.00000029 and the signal line at -0.00000030. This means there is minimal divergence, indicating weak momentum overall.
- The MACD histogram is also showing no significant activity, confirming that neither the bulls nor the bears are currently in control.
Given this lack of strong momentum, traders may want to stay cautious before jumping into any significant positions.
Volume Analysis: Low Activity
Volume is another critical factor when analyzing price action, and in BONK’s case, it tells an interesting story. The Volume SMA (9) is currently sitting at 20.22B, but overall volume appears to be on the lower side. The lack of strong trading volume suggests that there’s a sense of indecision in the market.
Without a significant increase in volume, it’s unlikely that BONK will see any major price movements in the short term. Traders will need to keep an eye on volume spikes, as they could indicate the start of a new trend—whether that’s up or down remains to be seen.
Recent News and Sentiment
While BONK’s price action has been relatively quiet, there’s no shortage of buzz around meme coins in general. Recently, Dogecoin and other meme coins have seen renewed interest due to social media hype and endorsements from prominent figures. However, this hasn’t translated into a significant rally for BONK just yet.
That being said, meme coins often move quickly when sentiment changes, so BONK could surprise everyone if the right catalyst comes along. For now, though, traders should remain cautious and avoid making decisions based purely on speculative hype.
Trading Strategies: What Should You Do?
For Short-term Traders:
- Range Trading Strategy: Given BONK’s current range-bound behavior, you could try buying at support near 0.00001950 and selling near resistance at 0.00002050. Be sure to place tight stop-losses below 0.00001900 to manage risk in case of a breakdown.
- Breakout Strategy: If BONK breaks above 0.00002050 with volume, this could signal a short-term recovery. In that case, target 0.00002150 or higher. Conversely, if BONK drops below 0.00001950, short opportunities could present themselves.
For Long-term Investors:
- Accumulate Strategy: If you believe in the long-term potential of BONK and its community-driven growth, this could be a good time to accumulate. The current downtrend could represent an attractive entry point for those with a high-risk tolerance.
- Hold Strategy: If you already own BONK, it might be worth holding on through this period of consolidation. Meme coins are notoriously volatile, and a single positive catalyst could send the price soaring. However, be prepared for the potential of further downside.
Final Thoughts: Can BONK Rebound?
BONK is currently facing a challenging period, with the price hovering around critical support levels. The technical indicators suggest that the token is lacking momentum, with moving averages and MACD pointing to continued consolidation or further downside. However, meme coins are known for their sudden reversals, so it wouldn’t be surprising to see BONK bounce if market sentiment shifts in its favor.
In the short term, traders should keep a close watch on the 0.00001950 support and 0.00002050 resistance levels, as a breakout in either direction could signal the next major move for BONK. Long-term investors who believe in the project’s meme appeal may view the current price as a potential buying opportunity, but they should be prepared for volatility.
Looking for more analysis and market insights? Follow my blog on Binance Square for detailed crypto updates. Also, don’t miss out on joining my Telegram channel to stay up-to-date with the latest crypto news and tips—join here.

