The crypto world has seen its fair share of meme coins, and the Book of Meme (BOME) is the latest to catch the attention of traders. Over the past few days, BOME has experienced a significant surge, driving speculation around its price movements and potential growth. In this analysis, we’ll explore the key technical indicators, provide a forecast for future price action, and offer recommendations for both short-term traders and long-term investors.
Technical Analysis of BOME
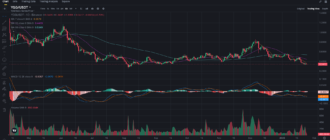
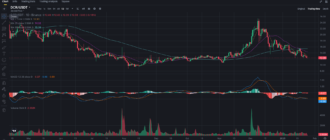
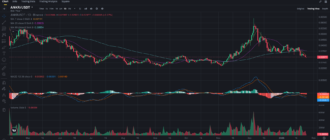
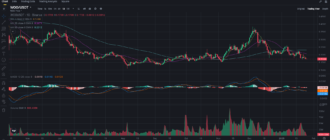
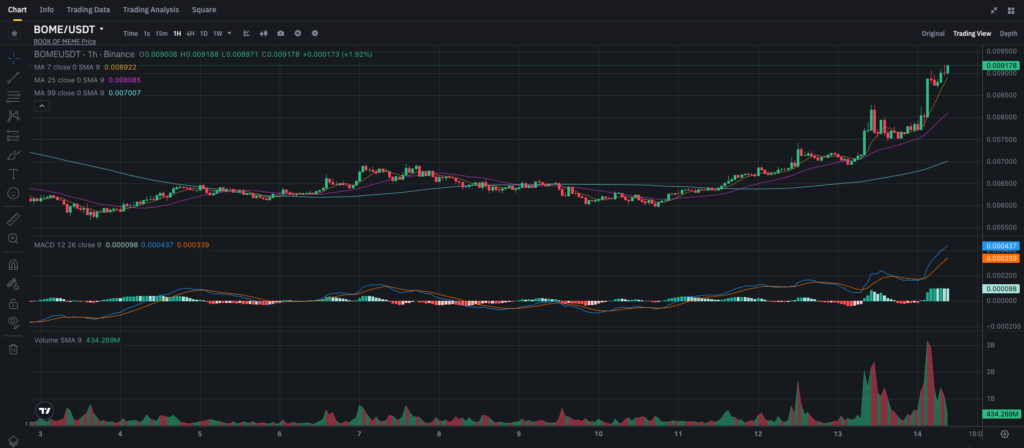
As of this writing, BOME is trading around 0.0009178, with a recent breakout in price action that has piqued the interest of market participants. The upward movement follows a period of consolidation, and the question now is whether this rally has more room to grow or if we are due for a correction.
Support and Resistance Levels
- Immediate Resistance at 0.00092: BOME is currently testing the 0.00092 level, which represents a significant short-term resistance. If the coin breaks this level, we could see a continuation of the bullish trend.
- Major Resistance at 0.00095: If BOME manages to push past the 0.00092 level, the next key resistance will be at 0.00095. This is a psychological level that could be tough to breach unless the volume increases significantly.
- Support at 0.00088: On the downside, the nearest support level is at 0.00088, which is reinforced by the 7-period SMA (Simple Moving Average). A dip below this level could indicate the start of a short-term pullback.
- Key Support at 0.00080: If a correction occurs, the 25-period SMA at 0.00080 could provide strong support. This level has acted as a critical base during past consolidations, making it an important zone to watch.
Moving Averages: Short-term Momentum in Full Swing
The 7-period SMA at 0.00089 is trending upwards, which reflects the current short-term bullish momentum. The 25-period SMA at 0.00080 provides additional support and shows that BOME is currently trading well above its short-term average, a positive sign for bulls.
On the longer time frame, the 99-period SMA sits at 0.00070, further confirming that the broader trend remains bullish. A significant drop back to this level seems unlikely unless the overall market sentiment turns negative.
MACD: Strong Bullish Signal
The MACD (Moving Average Convergence Divergence) indicator is currently showing a strong bullish crossover, with the MACD line at 0.000437 above the signal line at 0.000339. The histogram bars are also widening in positive territory, indicating growing buying pressure.
However, traders should be cautious, as a flattening of the histogram or a narrowing of the MACD and signal lines could suggest that the momentum is starting to fade. For now, though, the indicator supports the idea of continued upward movement in the short term.
Volume: Elevated Trading Activity Supporting the Rally
The Volume SMA (9) is sitting at a high 434.269M, with recent volume spikes coinciding with price increases. High trading volume during upward price movements is a sign that the rally could continue. However, a drop in volume while the price rises could indicate weakening demand, which might precede a correction.
Market Sentiment: The Meme Factor
As with most meme tokens, sentiment and social media buzz play an outsized role in price movements for BOME. Although no major fundamental news has surfaced recently, the broader crypto market’s current bullish sentiment around meme coins has undoubtedly helped fuel BOME’s rise.
With the recent price increase, BOME has garnered attention from both retail traders and speculative investors. The rapid appreciation in price has heightened the token’s visibility, but caution is necessary, as such coins often experience large price swings driven by hype.
Trading and Investment Strategy
For Short-term Traders:
- Look for a Breakout Above 0.00092: If BOME can decisively break through the 0.00092 resistance level, short-term traders might want to jump in for a quick gain. The next target would be 0.00095, and a move beyond that could result in a rapid price surge.
- Watch for a Pullback to 0.00088: If the price fails to break resistance, a pullback to 0.00088 is likely. This would provide a good entry point for traders looking to ride the next leg up. A dip below 0.00088 would indicate further downside potential, at which point the 0.00080 level would become critical support.
For Long-term Investors:
- Consider Buying on Dips: Given the overall bullish trend, long-term investors could look to accumulate BOME around the 0.00088 or 0.00080 support levels. These zones offer relatively low-risk entry points for those looking to hold through future volatility.
- Hold for Larger Gains: Meme coins like BOME can experience explosive growth, especially if they gain more traction. Investors willing to hold through short-term fluctuations could see gains if BOME manages to break above 0.00092 and test the 0.00095 resistance, with potential for even higher gains over the coming weeks.
Price Prediction: What’s Next for BOME?
Looking at the current technical indicators and market sentiment, BOME has the potential to continue its upward trajectory in the short term. If the 0.00092 resistance is broken, the price could quickly head toward 0.00095, a key psychological level. If the rally sustains its momentum, BOME could even challenge the 0.00100 mark in the near future.
However, traders should be cautious of a potential correction. A failure to break 0.00092 could result in a pullback to 0.00088 or even 0.00080, where significant support lies. In the longer term, if meme coin hype continues, BOME could see another major leg up.
Conclusion: Can BOME’s Rally Sustain?
Book of Meme (BOME) is currently riding a wave of bullish momentum, supported by strong technical indicators and high trading volume. The MACD is showing bullish signals, while the moving averages suggest the uptrend is still intact. That said, meme coins are notoriously volatile, and traders should be prepared for sharp price swings.
Short-term traders should look for a breakout above 0.00092, while long-term investors could consider accumulating on dips around 0.00088 or 0.00080. Whether you’re a day trader or a long-term holder, keep an eye on the volume and MACD for early signs of trend reversals.
For more detailed analysis and trading strategies, follow my blog on Binance Square and don’t forget to join my Telegram channel to stay updated on the latest crypto trends.


