BNB (Binance Coin) has been a key player in the cryptocurrency world, powering the BNB Smart Chain and supporting a host of decentralized applications. But lately, BNB has faced a string of price fluctuations, leaving traders uncertain about its next move. The question on everyone’s mind is simple: Is BNB ready to bounce back, or will it continue its recent downtrend? Let’s take a closer look at the charts, key indicators, and possible strategies for traders and investors alike.
Chart Analysis: BNB’s Recent Price Movement
1-hour Chart Breakdown
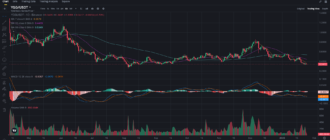
On the 1-hour BNB chart, we see that BNB has been consolidating just above the $540 mark, which has acted as support over the past few sessions. The price is currently hovering around $549, while the 7-period Simple Moving Average (SMA) is providing immediate support at $547. The 25-period SMA is holding slightly lower at $544, creating a tight range for short-term price action. Meanwhile, the 99-period SMA at $557 acts as a key resistance, which BNB will need to break to regain bullish momentum.
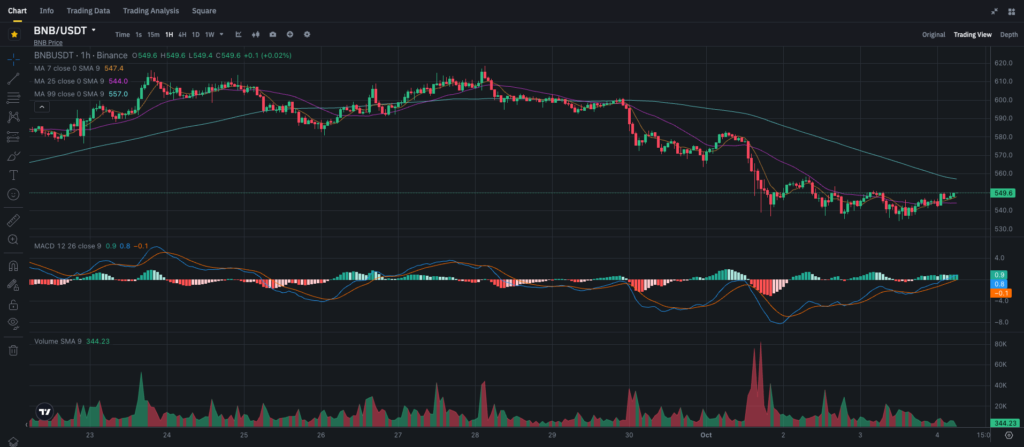
The price is inching closer to the 99-SMA, suggesting that a breakout might be on the horizon. However, the consolidation phase indicates hesitation among traders, as BNB has yet to make a decisive move upward.
4-hour Chart Overview
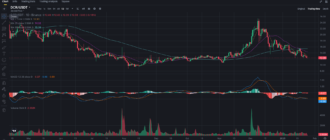
Shifting to the 4-hour chart, BNB has had a rough time breaking past its 99-SMA, currently resting around $578. The 7-period SMA at $544 and 25-period SMA at $556 are also converging, suggesting that BNB is preparing for a significant move. The battle between bulls and bears seems to be intensifying, and the next few days will likely be crucial in determining whether BNB will experience a solid recovery or face further declines.
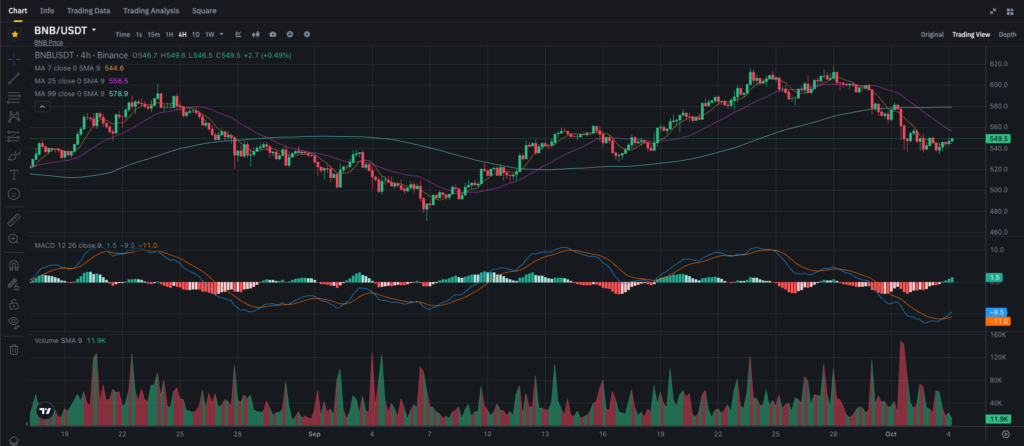
BNB has been in a downtrend since it failed to break above $600 in late September, and the selling pressure has been consistent since then. However, the current support around $540 is holding strong, preventing further downside—for now.
MACD Indicator: Mixed Signals
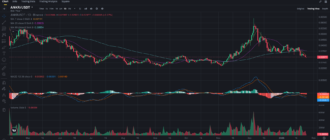
On the 1-hour chart, the MACD (Moving Average Convergence Divergence) shows signs of a potential bullish crossover. The MACD line is slightly above the signal line, and the histogram is showing small green bars, indicating a weakening of the bearish momentum. However, this signal remains weak, and traders should wait for a more pronounced move before jumping into long positions.
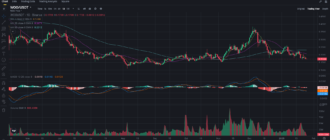
The 4-hour MACD paints a different picture. Here, the MACD line is still below the signal line, and the histogram is printing red bars, indicating bearish momentum still dominates on this timeframe. The MACD value at 1.5 is slowly climbing, but it hasn’t turned positive just yet, suggesting that while a reversal might be brewing, it’s not fully confirmed.
Key Levels to Watch: Support and Resistance
- Support: $540 – BNB has tested this level multiple times over the past week. If it breaks below this, we could see a further decline toward $530, a critical psychological level.
- Resistance: $557 – The 99-SMA on the 1-hour chart is the immediate resistance, with a stronger resistance at $578 on the 4-hour chart. A break above these levels would be a strong bullish signal and could push BNB back into the $580-$600 range.
BNB traders should keep a close eye on these levels. A break above resistance could indicate a trend reversal, while a failure to hold support may signal more downside ahead.
Current Market Sentiment and Trends
The broader cryptocurrency market has been relatively quiet, with many assets consolidating after recent volatility. BNB is no exception, as it has been moving in a narrow range between $540 and $550. Binance Coin’s price action is heavily influenced by the overall market sentiment, particularly Bitcoin’s movements, which have been similarly cautious.
Additionally, with Binance expanding its ecosystem and BNB continuing to be a utility token on Binance Smart Chain (BSC), the long-term outlook for BNB remains strong. However, short-term traders may find the current range-bound environment challenging unless a breakout occurs.
Trading and Investment Recommendations
Short-Term Traders:
For short-term traders, the strategy is clear: keep an eye on the key resistance level of $557. A breakout above this on the 1-hour chart could provide an excellent opportunity for a quick long position, with a target around $570-$580. However, if BNB fails to break above this level, it might be wise to stay on the sidelines or even consider shorting BNB if it breaks below $540.
The MACD on the 1-hour chart is giving early signs of a reversal, but don’t jump in too quickly—wait for confirmation via a break above the 99-SMA.
Long-Term Investors:
Long-term investors who believe in Binance’s continued growth and the increasing utility of BNB within its ecosystem should view the current dip as a buying opportunity. BNB is currently trading well below its recent highs, and accumulating more at these levels could prove to be a profitable strategy over the long term.
If you’re willing to hold through the volatility, consider dollar-cost averaging (DCA) to reduce the impact of short-term fluctuations. A breakdown below $540 might offer an even better entry point, but don’t wait too long, as a quick bounce could occur if the market turns bullish.
Conclusion: BNB at a Turning Point
BNB is in a pivotal position, with strong support around $540 and significant resistance at $557. A breakout above resistance could see BNB rally toward $580, while a breakdown below support could lead to further declines. For short-term traders, this is a time for caution—wait for confirmation before entering a position. For long-term investors, accumulating during these dips could offer a solid opportunity as Binance Coin remains a key player in the crypto ecosystem.
Don’t miss out on the latest market insights—follow my blog on Binance Square for daily updates and trade strategies at Binance Square. Let’s navigate these markets together and stay ahead of the game!


