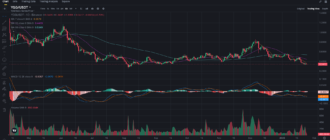
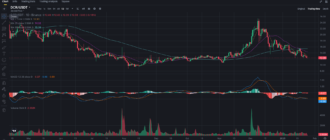
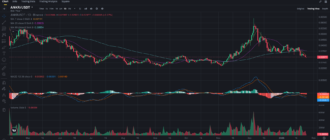
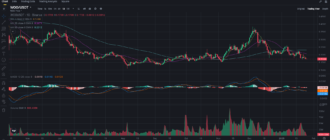
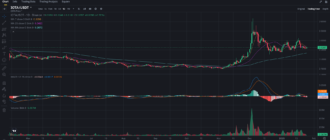
As we analyze the recent performance of BNB, the native token of Binance, it’s clear that the price is hovering around a crucial juncture. Trading at $569 on the 1-hour chart, BNB is facing a mix of resistance and support levels that could dictate its next move. For both traders and long-term investors, the question arises: Is BNB preparing for a significant breakout, or is it due for a pullback?
In this article, we’ll break down the latest technical indicators, key price levels, and provide some actionable insights for those looking to trade or invest in BNB.
BNB Price Overview: Key Levels to Watch
Support and Resistance Levels
- Support: BNB is currently holding above the $562 support level, which coincides with the 99-period moving average on the 1-hour chart. This level has acted as a safety net for the token over the last few sessions, and a break below this could lead to a sharper decline, possibly toward the $550 psychological level.
- Resistance: On the upside, BNB faces resistance at $579, with the 25-period moving average hovering around this area. Breaking above this level could signal a recovery, with the next resistance at $590, where it struggled previously.
Moving Averages: What Are They Indicating?
- 7-period SMA at $569 is closely tracking the current price, suggesting indecision in the short term.
- 25-period SMA at $579 continues to act as a short-term ceiling for the price, creating resistance as BNB attempts to rise.
- 99-period SMA at $562 is providing key support and will be critical in determining whether the bulls can hold control or if the bears will push the price lower.
With the price sandwiched between these critical levels, it’s no surprise that traders are watching closely to see which side breaks first.
MACD Analysis: A Bearish Cross Looming?
- The MACD line is currently in bearish territory, reading -1.0, and is below the signal line at -0.3. This indicates that momentum is favoring the bears, but the gap isn’t massive, so a small uptick in buying could reverse this.
- The MACD histogram also points to weak momentum with declining bars, signaling that the bulls are struggling to maintain the current price action. A further increase in selling pressure could lead to a breakdown of the current support level.
Volume and Market Sentiment
Volume levels, indicated by the SMA (9) at 495.5k, show a significant decline compared to earlier sessions. This low trading volume can be interpreted in two ways: either the market is waiting for a catalyst before making a strong move, or there’s a lack of interest, which could eventually lead to a sell-off.

Sentiment around BNB remains mixed. On one hand, BNB benefits from its association with Binance, the world’s largest crypto exchange. On the other hand, general market uncertainty and regulatory concerns still loom large, making it difficult to gauge a clear direction.
Short-term vs. Long-term Trading Strategy
For Short-term Traders:
- Range Trading Strategy: With BNB trading between $562 and $579, there’s an opportunity for range trading. Buy near support at $562 with a tight stop-loss at $555 and aim for the resistance at $579.
- Breakout Strategy: If BNB manages to break above $579, traders could look to go long, targeting $590 or higher. A breakout could be confirmed with an increase in volume, providing a good entry point for short-term gains.
For Long-term Investors:
- Accumulate on Dips: BNB remains one of the most prominent tokens in the crypto space due to its utility on the Binance platform. Long-term investors might want to consider accumulating at lower levels, especially if BNB dips below $562, as the project’s fundamentals remain strong.
- Hold for Future Growth: If you’ve already bought BNB, holding through the current consolidation phase might be the best course of action, especially if you believe in the long-term prospects of Binance and its expanding ecosystem.
Will BNB Bounce Back or See Further Declines?
The BNB price chart is giving mixed signals right now. With support at $562 and resistance at $579, traders should keep a close eye on volume and momentum indicators to confirm the next move. A break below support could signal a steeper decline, while a push above resistance could spark a new rally toward the $590 level and beyond.
In the short term, the market appears cautious, but long-term prospects for BNB remain positive. Keep an eye on upcoming Binance-related announcements and broader market movements to gauge whether BNB will break out of this consolidation phase.
Want more insights and in-depth analysis on BNB and other crypto assets? Follow my blog on Binance Square for daily updates, trade setups, and news that could impact your portfolio.


