
Bitcoin (BTC) is the king of crypto, but even the king isn’t immune to price corrections. At the time of writing, BTC is trading around $62,500, showing signs of a pullback after an earlier attempt to break above $63,500. The big question on every trader’s mind right now is: Is this just a temporary dip or are we headed for a deeper correction?
In this post, we’ll dive deep into Bitcoin’s recent price action, analyze key technical indicators, and discuss what traders and investors should watch for in the coming days.
Bitcoin Price Overview: Can BTC Hold Key Support Levels?
Bitcoin has been on a rollercoaster ride over the past week. After reaching a high near $67,000, BTC has retraced and seems to be struggling to find firm support. The $62,500 level appears to be a key area of interest, with both bulls and bears battling to control this price zone.
Key Support and Resistance Levels
- Support: Bitcoin’s first major support lies at $62,000. If this level holds, it could provide a solid base for another upward move. Further down, $60,000 is the next psychological support level that traders will be watching closely.
- Resistance: On the upside, BTC needs to break through the $63,500 resistance to build momentum for a retest of $65,000. This is a critical level for Bitcoin to overcome before it can make a serious push towards its all-time highs.
Technical Indicators: What Are They Telling Us?
Moving Averages
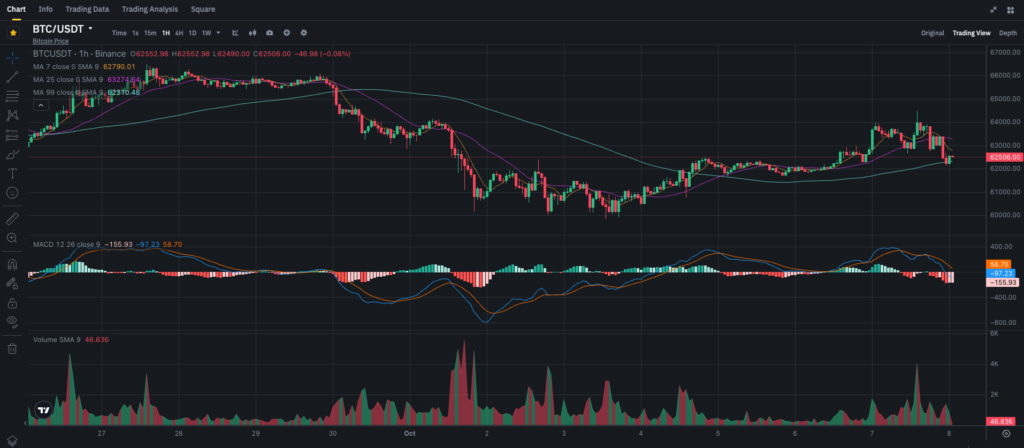
- The 7-period SMA at $62,709 is sloping downwards, indicating short-term bearish pressure. However, the 25-period SMA at $63,274 is still showing strength, signaling that Bitcoin’s overall trend may remain intact if it finds support soon.
- The longer-term 99-period SMA, currently at $62,310, has acted as a key support level multiple times over the past few days. A break below this could signal more downside to come, but holding above it could inspire renewed bullish sentiment.
MACD (Moving Average Convergence Divergence)
- The MACD line has turned bearish, with a reading of -97.23, significantly below the signal line, which is at 58.70. This crossover is a negative sign for short-term momentum, suggesting that Bitcoin may continue to experience selling pressure in the near term.
- The MACD histogram is also deep in the red, further confirming the bearish shift in momentum.
Volume and Market Sentiment
Trading volume remains moderate, with the Volume SMA (9) sitting at 46.836k. This lack of strong volume on the recent decline could be a sign that the sell-off is not yet panic-driven, but traders should be cautious. Increased volume on any further downward move could indicate stronger selling pressure, which might push BTC lower.
Sentiment in the broader market remains cautiously optimistic. While Bitcoin’s recent pullback has raised some eyebrows, many analysts and investors still believe the long-term outlook for BTC is bullish, especially with growing institutional interest and Bitcoin ETFs gaining approval in some markets.
Fundamental Drivers: What Could Be Affecting Bitcoin’s Price?
Several macro factors could be influencing Bitcoin’s current price action. Here are a few key ones:
- Global Economic Concerns: Worries about rising interest rates, inflation, and regulatory uncertainty are affecting all markets, including crypto. Bitcoin’s price is often seen as a hedge against inflation, but short-term market fears can still cause sell-offs.
- Institutional Activity: There has been a notable increase in institutional participation in Bitcoin markets recently. However, large players often sell during periods of profit-taking, which could explain some of the recent downward pressure.
- Technical Corrections: After hitting a high near $67,000, Bitcoin was due for a technical correction. Markets rarely move straight up, and Bitcoin’s current pullback may just be a healthy reset before another attempt at higher prices.
Trading Strategy: What’s the Best Approach Right Now?
With Bitcoin at a critical juncture, traders need to be cautious but opportunistic. Here’s what to consider based on your trading or investing horizon:
For Short-term Traders:
- Bounce Strategy: If Bitcoin holds support around $62,000, short-term traders could look for a bounce play targeting $63,500. Entering a long position here with a tight stop-loss just below $62,000 could offer a good risk-reward ratio.
- Breakdown Strategy: If BTC breaks below $62,000, a quick move down to $60,000 could be on the cards. Shorting on a confirmed breakdown below support with a stop just above $62,500 could be an effective strategy to capture any further downside.
For Long-term Investors:
- Buy the Dip: Long-term believers in Bitcoin’s value as digital gold or a hedge against traditional financial markets might consider this pullback a buying opportunity. Accumulating BTC at or below $62,000 could prove to be a smart move if the bullish long-term trend resumes.
- Hold for Long-term Gains: If you’re already holding Bitcoin, this pullback may not be a reason to sell. The long-term fundamentals of Bitcoin remain strong, with adoption continuing to grow, and institutions increasingly viewing BTC as a legitimate asset class.
Conclusion: Is Bitcoin’s Correction Just a Bump in the Road?
While Bitcoin’s recent price action has raised concerns about a deeper correction, it’s important to remember that pullbacks are a natural part of any market cycle. Key technical indicators are flashing mixed signals, but Bitcoin remains above important support levels, which could suggest that the bulls aren’t done yet.
For short-term traders, this is a time to watch key levels closely and be ready to act on a confirmed breakout or breakdown. Long-term investors, on the other hand, may view this as a chance to buy more BTC at a discount, confident in the asset’s future potential.
If you’re looking for more in-depth crypto analysis and trade ideas, don’t forget to subscribe to my blog on Binance Square for more updates and insights.


