Bitcoin (BTC) remains the undisputed leader of the crypto market — a symbol of financial transformation and the asset that continues to set the tone for the entire industry. After the explosive rally in early 2025, when BTC surged above $120,000, the market shifted into a prolonged consolidation phase. Now, as 2025 draws to a close, Bitcoin is hovering between cautious optimism and the fear of missing the next big move.
Technical Analysis of the BTC Chart
On the daily chart, Bitcoin is trading around $107,000, sitting right between critical support and resistance zones that have become increasingly defined.
The main support lies between $104,000–105,000, where buyers have repeatedly stepped in to stop declines. Below that, the next support area sits at $98,000–100,000 — a break under this range could trigger a deeper correction.
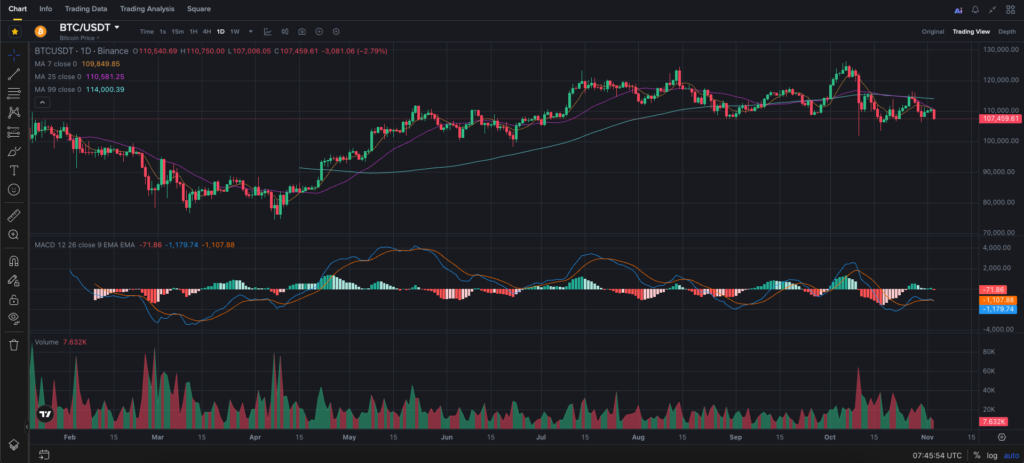
The key resistance level is found at $114,000–115,000, where the long-term MA 99 currently runs. A confirmed breakout above this area would mark the return of bullish momentum and open the door toward $120,000 and even $125,000.
Overall, the chart reflects consolidation — shrinking volatility and reduced trading volume. This kind of compression often precedes major market moves, suggesting Bitcoin may be storing energy for its next breakout.
Indicator Analysis: MA and MACD
Moving averages are sending mixed signals.
The short-term MA 7 remains below MA 25, confirming the short-term dominance of sellers. However, the price is still holding above key support levels, keeping the broader trend neutral rather than bearish.
The long-term MA 99 sits above the current price — a classic sign of a post-rally accumulation phase.
The MACD indicator stays in negative territory, yet its histogram is flattening, showing a slowdown in bearish momentum. The gap between the MACD and signal lines is narrowing — the market appears close to a potential bullish crossover. A move of the MACD line above zero in the coming weeks would serve as a strong confirmation of trend reversal.
Trading volumes have also decreased, typical for consolidation periods. Large players seem to be waiting for direction before injecting liquidity back into the market.
Bitcoin Price Forecast for 2026
Based on the current structure, Bitcoin seems to be finishing its correction phase and preparing for the next leg of the cycle. If BTC holds above $104,000 and breaks resistance near $115,000, 2026 could bring a transition into a sustained bullish trend.
Under the base scenario, the price target sits between $150,000–180,000, while a more optimistic case could push BTC toward $200,000–220,000.
If support fails and the price dips below $100,000, a longer consolidation in the $85,000–95,000 range may occur through mid-2026 before a recovery fueled by renewed market sentiment.
Momentum and technicals still lean bullish — volatility is contracting, moving averages are aligning, and MACD is nearing a crossover point.
Fundamental Drivers and Market Trends
Several fundamental factors could shape Bitcoin’s trajectory in 2026.
First, institutional interest continues to grow: major funds are expanding exposure through ETFs and custody products.
Second, Bitcoin’s supply keeps tightening — post-halving mining rewards have dropped, pushing production costs higher and forming a natural price floor.
Third, macroeconomic factors — a weaker dollar, potential Fed rate cuts, and global appetite for decentralized assets — all create a favorable backdrop for BTC growth.
Psychology also plays a role: after months of uncertainty, investors are searching for a fresh growth story. Bitcoin still holds that role — the digital gold with unmatched credibility and resilience.
Possible Strategies for Traders and Investors
For Short-Term Traders
In the near term, all eyes are on the $104,000–115,000 range. A breakout above with strong volume could trigger an impulsive rally toward $120,000–125,000. Conversely, a breakdown below $104,000 might extend the correction to $98,000–100,000.
This range can serve as a framework for breakout or rebound strategies, with profit-taking opportunities around resistance zones.
For Long-Term Investors
For those targeting 2026 and beyond, gradual accumulation around $100,000–105,000 appears strategically sound. Even with short-term dips, Bitcoin’s long-term growth potential remains significant — limited supply, institutional adoption, and macro trends all support higher valuations.
When BTC approaches $180,000–200,000 in 2026, partial profit-taking could be considered if the market shows signs of overheating.
Conclusion
Bitcoin’s current technical setup resembles a coiled spring: a phase of uncertainty that’s close to resolution. The support zone around $104,000 remains intact, trading volumes are stabilizing, and MACD hints at an upcoming shift in momentum.
If the bullish scenario unfolds, 2026 could mark the start of Bitcoin’s next major rally, potentially driving the entire crypto market toward new highs.
Bitcoin remains the ultimate barometer of crypto sentiment and is available for trading on leading exchanges — Binance, Bybit, and HTX.