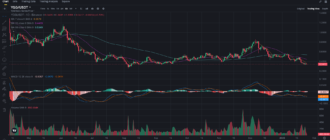
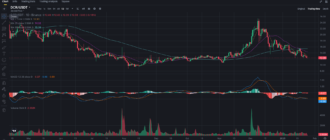
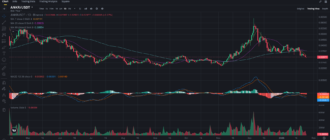
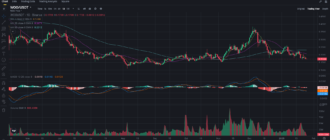
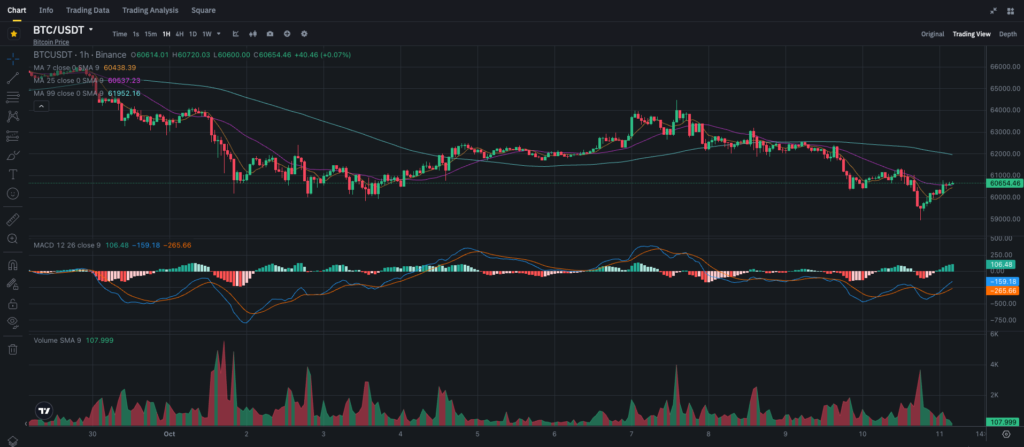
Bitcoin (BTC), the king of cryptocurrencies, has been on a rollercoaster lately, moving from highs above $63,000 to a recent dip below the $60,000 psychological barrier. The market has been reacting to various global factors, including rising inflation fears, regulatory uncertainty, and market-wide corrections. But where is Bitcoin headed now? Let’s dive into the current price action, chart analysis, and indicators to forecast the next potential move.
Key Levels: Support and Resistance
Understanding where Bitcoin finds support and resistance is crucial to anticipating its next move. At the moment, Bitcoin is hovering around a crucial level, and these price zones will likely determine the next leg of its journey.
Support Levels:
- $60,000: This is the key psychological support that Bitcoin just bounced off from. If BTC maintains this level, it could provide a strong base for upward movement.
- $58,000: If the price breaks below $60,000, the next level to watch is around $58,000. Historically, this zone has provided strong support, but a drop below this could trigger further selling.
Resistance Levels:
- $61,950: This is the first resistance to break, as marked by the 99-period SMA. A successful breakout above this could open the door to higher price levels.
- $62,500: This is a secondary level to watch, aligned with previous price action. A push above this level could see Bitcoin testing $63,000 and beyond.
Moving Averages: Mixed Signals
Bitcoin is currently trading between its short- and long-term moving averages, indicating a mixed sentiment in the market.
- The 7-period SMA sits at $60,484, and Bitcoin is currently trading just above this level. While this short-term indicator points to a potential recovery, BTC is still far below the 25-period SMA at $60,857, which indicates that buyers are hesitant to push the price higher.
- The 99-period SMA, which is a long-term trend indicator, sits around $61,952. A breakout above this level would suggest a more sustained upward movement, but until then, Bitcoin remains in a neutral-to-bearish zone.
MACD: Bullish Momentum Building?
The MACD (Moving Average Convergence Divergence) is showing signs of a potential shift in momentum, but caution is still advised.
- The MACD line is at 106.48, with the signal line at -159.18, indicating that the bullish momentum is slowly gaining strength.
- The MACD histogram has moved into positive territory, which suggests that the bearish momentum is fading, and we might be seeing the early stages of a trend reversal.
That being said, the MACD has yet to fully cross over into bullish territory, so traders should remain cautious until the signal is stronger.
Volume: A Critical Factor for Breakout
Looking at the volume can help gauge the strength of the current price movement. The Volume SMA (9) stands at 107.999K, and while this is decent, it isn’t showing the kind of surging interest you would expect for a massive breakout.
Bitcoin needs a significant boost in volume to confidently break through the overhead resistance levels. If the volume remains tepid, BTC might continue to range between $60,000 and $62,000 before making a decisive move.
Market Sentiment: A Tug of War
Bitcoin’s price action lately has been heavily influenced by broader market sentiment. There have been a few critical developments that have impacted the price, such as:
- U.S. Inflation Data: Rising inflation has made Bitcoin more attractive as a hedge against the dollar’s devaluation, but the market is still waiting for clarity on interest rates and regulatory decisions.
- Regulatory Concerns: Ongoing regulatory scrutiny from U.S. agencies, including the SEC, has created some uncertainty for Bitcoin’s future. Investors are watching these developments closely, which is likely keeping a lid on bullish sentiment.
- Institutional Interest: While Bitcoin has seen some large-scale institutional interest in 2023, these players remain cautious, especially as other macroeconomic factors come into play. Any news related to big institutional players entering or exiting Bitcoin positions could significantly impact the price.
Trading and Investment Recommendations
For Short-term Traders:
- Scalping and Range Trading: With Bitcoin trading between $60,000 and $62,000, this could be a good opportunity for range traders. Buying around the support level of $60,000 and selling near $62,000 could yield short-term profits. However, a tight stop-loss below $59,500 is advisable in case of a breakdown.
- Breakout Trading: Traders looking for larger gains might want to wait for a confirmed breakout above $62,000, with a potential target of $63,500 or even $65,000. Make sure to watch the volume closely, as a weak breakout may not hold.
For Long-term Investors:
- Accumulate and Hold: For those with a long-term view, accumulating Bitcoin around $60,000 makes sense. This level has proven to be a strong support zone in previous corrections, and with Bitcoin’s long-term bullish outlook, it could be a good buy zone for future appreciation.
- Wait for Confirmation: If you’re more conservative, waiting for a clear break above the 99-period SMA around $61,950 could provide more confidence that a bullish trend is returning.
Conclusion: Bitcoin Poised for a Bounce?
Bitcoin has shown resilience by bouncing off the $60,000 support level, but it still faces key resistance levels around $62,000 and $63,500. The MACD indicator is showing early signs of bullish momentum, but until we see a breakout above the 99-period SMA, the market could remain indecisive.
Short-term traders have opportunities to trade within the current range, while long-term investors may find this a good time to accumulate, as the $60,000 level has held strong in previous downturns. Keep a close eye on volume and market sentiment, as these will likely dictate Bitcoin’s next major move.
For more insights and real-time updates, make sure to follow my blog on Binance Square and join my Telegram channel for discussions and analysis.


